
In our last article, I wrote about how to improve accuracy when analysing suspension data. When making changes to suspension shim stacks however, it can be extremely helpful to know how fast the suspension is actually moving, to know which part of the damping system to target i.e. the mid-valve or base valve stack on forks for example. In this article, we will look at sample data from one track. So let’s jump straight into it.
All speeds shown in each graph are metres per second, and the graphs show the lap overall average, as well averages for different sections of track.
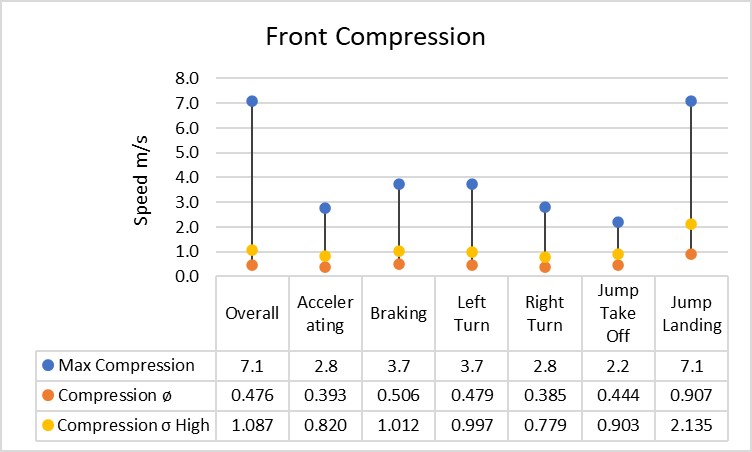
The graph above shows the average compression speed of the front forks for the overall lap, as well as different sections of the track.
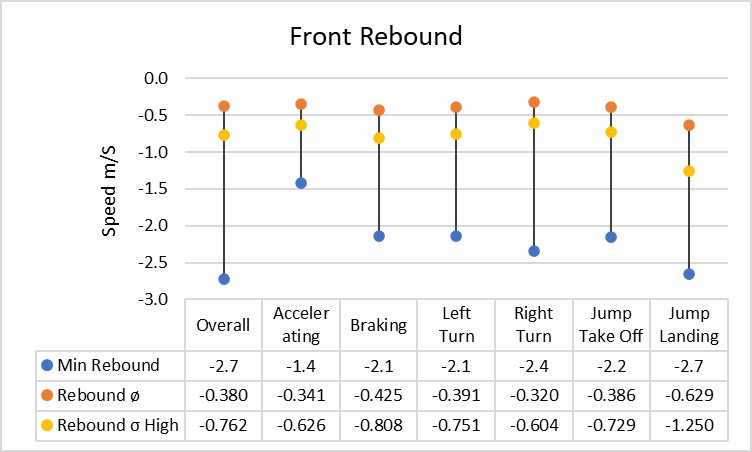
The graph above shows the average rebound speed of the front forks for the overall lap, as well as different sections of the track.
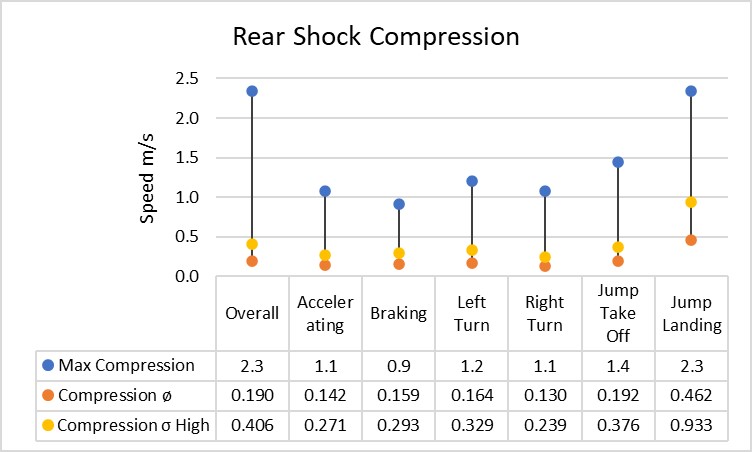
The graph above shows the average compression speed of the rear shock for the overall lap, as well as different sections of the track.
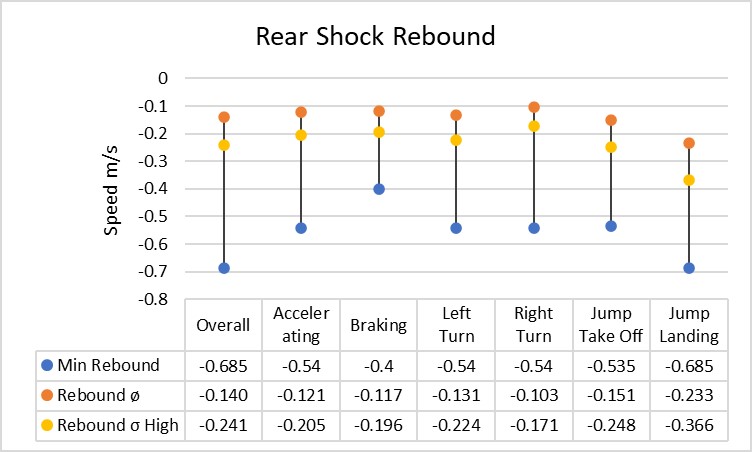
The graph above shows the average rebound speed of the rear shock for the overall lap, as well as different sections of the track.
One thing that might be jumping out at you is that the fork speeds are much higher than the shock speeds. This is because the front axle is connected directly to the fork, whereas the rear axle is connected to the swingarm, and then through the linkage. This connection reduces the speed from the rear axle to the shock by around 3:1.
There are also some observations which we knew already from the last article, like how the fastest speeds are measured at the jump take offs, and how the compression speeds are slightly higher when braking into a turn, than accelerating.
From my experience, it has to be said that the speed of the rider, the speed of the track and the roughness of the track can all have a significant impact on the average speed values measured, and just because an overall fork compression value of 0.476m/s works well on one track, it absolutely doesn’t mean that this is a target value to aim for at every other track.
When you match this data up with a force / speed graph from a suspension dyno, and with experience know which areas of the curve relate to which part of the shim stack, this data becomes incredibly useful in finding answers fast to suspension setup problems.
If you would like to work with the Motoklik system, or have any questions, e-mail [email protected]
Kind Regards,
Jens