fbpx Skip to main content

Are Suspension Coatings worth it?

All bikes come from the factory with shiny chrome forks stanchions, and then somewhere along the line, we get the idea that a new coating will make them much better. Is this real, or do we just like shiny new things and different colours?

Firstly, why do all the manufacturers use Chrome from the factory?

The answer is very simple; cost. Applying chrome to steel is a relatively low cost process compared to more complex procedures used for Titanium Oxide (TiO2), Titanium Nitride (TiN) and Diamond Like Coatings (DLC). Applying chrome is done in a five step process.

1: Clean the steel tube.

2: Dip the tube in an acid to etch the surface i.e. chemically remove any surface impurities such as iron-oxide (rust).

3: Electro plate the steel tube by giving it a negative charge, and dip it into a bath of positively charged chromium based liquid. The positively charged chrome particles bond with the negatively charged tube.

4: Rinse clean the tube after taking it from the bath.

5: Polish the surface to leave a smooth finish.

Complicated as this procedure sounds, it’s actually easier and cheaper than TiO2, TiN or DLC. So what is the benefit of these coatings over steel?

When you think about it practically, there are probably two main areas that we would like to try and improve:

1. Friction.

2. Robustness to damage.

At a stretch we could also include reducing weight, but even chrome coating is only 0.03mm (0.0012 inches) thick, so there isn’t a whole lot to be gained from changing to a different material. Let’s take a look at friction then.

Happily, there is a unit of measure we can use for this, it’s called the “coefficient of friction” and  it represents the relationship between two forces. In this instance it’s the force needed to move an object on a surface, divided by the weight of that object in Newtons. For example, if you have a 1kg (9.81N) block of rubber on concrete, and it takes a force of 5N to move it, the coefficient of friction is 0.51. There are even standardised tests for measuring friction, one of them is called the ASTM G99 and you can watch a video of it here if you are as boring an engineer as I am. 

Basically, the material of a standard size is placed on a test bed and rotated against the bed and the forces are measured. The force needed to start an object moving from a static position is higher than the force needed to keep an object moving, so the test must overcome the static friction (sometimes called “stiction” in the motocross world) and then as the material is moving, we can get a measurement of the dynamic friction.

Now, that we know how the test is done, here are the values:

Chrome: Static: 0.16-0.20. Dynamic: 0.10-0.20.

TiO2: Static: 0.35-0.40. Dynamic: 0.30-0.35.

TiN: Static: 0.40-0.55. Dynamic: 0.30-0.50.

DLC: Static: 0.05-0.20. Dynamic: 0.05-0.15.

Ehhh OK. It looks like DLC has some potential, but why would we use TiO2 or TiN when the friction values from chrome are lower?

Let’s look at the benefits of TiO2, TiN and DLC over Chrome.

TiO2 offers better corrosion resistance.

TiN forms a very hard surface and offers better wear resistance.

DLC offers extremely low friction and better wear resistance.

You might have noticed I haven’t mentioned anodizing or Kashima coating, and this is because this mainly applies to aluminium rather than steel.

When we think about aluminium, while it is a very light material compared to steel, it is also a very soft material. Ideally we would really like to improve it’s hardness so that the wear resistance is improved, and it would also be nice to have lower friction when it comes to suspension.

A way that the hardness of aluminium can be improved is through anodising. Anodising is quite similar to chrome plating by:

1. Cleaning: The aluminium is thoroughly cleaned to remove dirt, grease, or surface contaminants. This ensures uniform anodizing.

2. Etching: The aluminium is etched with an acidic or alkaline solution (like caustic soda) to remove surface imperfections.

3. Desmutting: A solution, often nitric acid, removes residues or oxides left after etching.

4. Anodising: The aluminium is placed into an electrolytic bath, commonly made of sulfuric acid, chromic acid, or phosphoric acid, depending on the application. The aluminium acts as the anode (positive electrode), and a cathode (negative electrode), typically made of lead or stainless steel, is placed in the bath. A DC electric current is passed through the solution. Oxygen ions from the electrolyte combine with the aluminium atoms on the surface to form aluminium oxide (Al₂O₃).

It is the oxide layer that improves the hardness of the aluminium, but by how much?

Thankfully, there is another standardised test we can use which is called the Rockwell Hardness Test. In this test, a diamond point tipped tool is pressed into the material, and the test machine can measure how far into the material the pointed tip has gone.

The results are:

Untreated Aluminimum: 15 to 30 HRB

Anodised Aluminium: 60 to 65 HRC

This means that the anodised aluminium is 4-5 harder than untreated aluminium, great for wear resistance!

But what about our old friend friction? Well the answer isn’t wonderful when dry, and reasonable when lubricated:

CoF’s Untreated Aluminium: Static: 0.3 – 0.45, Dynamic: 0.2-0.4, Lubricated: 0.1-0.2

Sealed Anodised Aluminium: Static: 0.4-0.7, Dynamic: 0.3-0.5, Lubricated: 0.1-0.25

The surface oxide layer created during anodising is actually quite rough.

And this is where Kashima coating comes in. Kashima coating is a proprietary anodising process by a company called Miyaki Co. Ltd. in Japan. I don’t know why it’s called Kashima, initially I thought that might be the name of the person who developed the process, but I can’t find any information to confirm that.

Anyway, the Kashima process was developed to give aluminium the improved hardness from anodising, while at the same time reducing the friction, and this is done by having an additional lubricating molecule as part of the anodising process. How much does it work? Well take a look at the picture below from the Kashima website.

Back to the point of the article, are special coatings for your suspension worth it?

As usual, it comes back to your available budget, and/or the level you ride or race at. If you are a professional race team looking for every 1% of performance improvement, then DLC coated inner tubes and Kashima coated outer tubes are the way to go. If you are an average weekend warrior then maybe your money would be better spent keeping your suspension serviced, or buying the corrects springs for your weight and ability.

I hope you enjoyed this article 😀

Kind Regards, Jens

Ducati’s Data Driven Approach

“This technology has increased a lot, a lot in the last couple of years,” says Ducati race boss Gigi Dall’Igna. “We also did many things like this in the past but the results weren’t good, because you need to build up the data. Now AI is really important for us to achieve our results.”

Captain at the helm of the good ship Ducati in Moto GP, Luigi Dall’lgna has steered the factory team to its first world championship in 15 years when Francesco Bagnaia stood on top of the podium in 2022.

Ducati’s recent success didn’t come out of the blue however. This journey started as far back as 2017, when they decided to go “big on data and machine learning to improve MotoGP bikes”. Now, Ducati field 8 bikes in a race making up as much as 36% of the starting grid in Moto GP, and they do this for good reason.

Using AI and Machine Learning means using “Big Data”. You might have seen this term flashed around in the media over the past few years, but what it means is to make the most accurate predictions, we need a lot of data. I wrote an article about this type of thinking in August 2023 called “Making accurate predictions on suspension setup in motocross.” With Ducati having so many bikes on the track, it’s allowing them to create excellent models to test different scenarios and ultimately shave off lap time. For example, in Moto GP, the AI can simulate 8 different line choices in a corner, and determine which is the fastest, giving the rider confidence to know they are making the right decision on track.

This brings us to their Desmo 450 MX motocross project. From the very first pictures of the bike on track, spaterings of sensors have been strewn all over the motorcycle.  Ducati were also the only manufacturer to run full data throughout the whole race weekend at the MXGP of Arnhem last month for their debut. In this article, we will take a look at the type of data being measured, and how it could prove useful for racing.

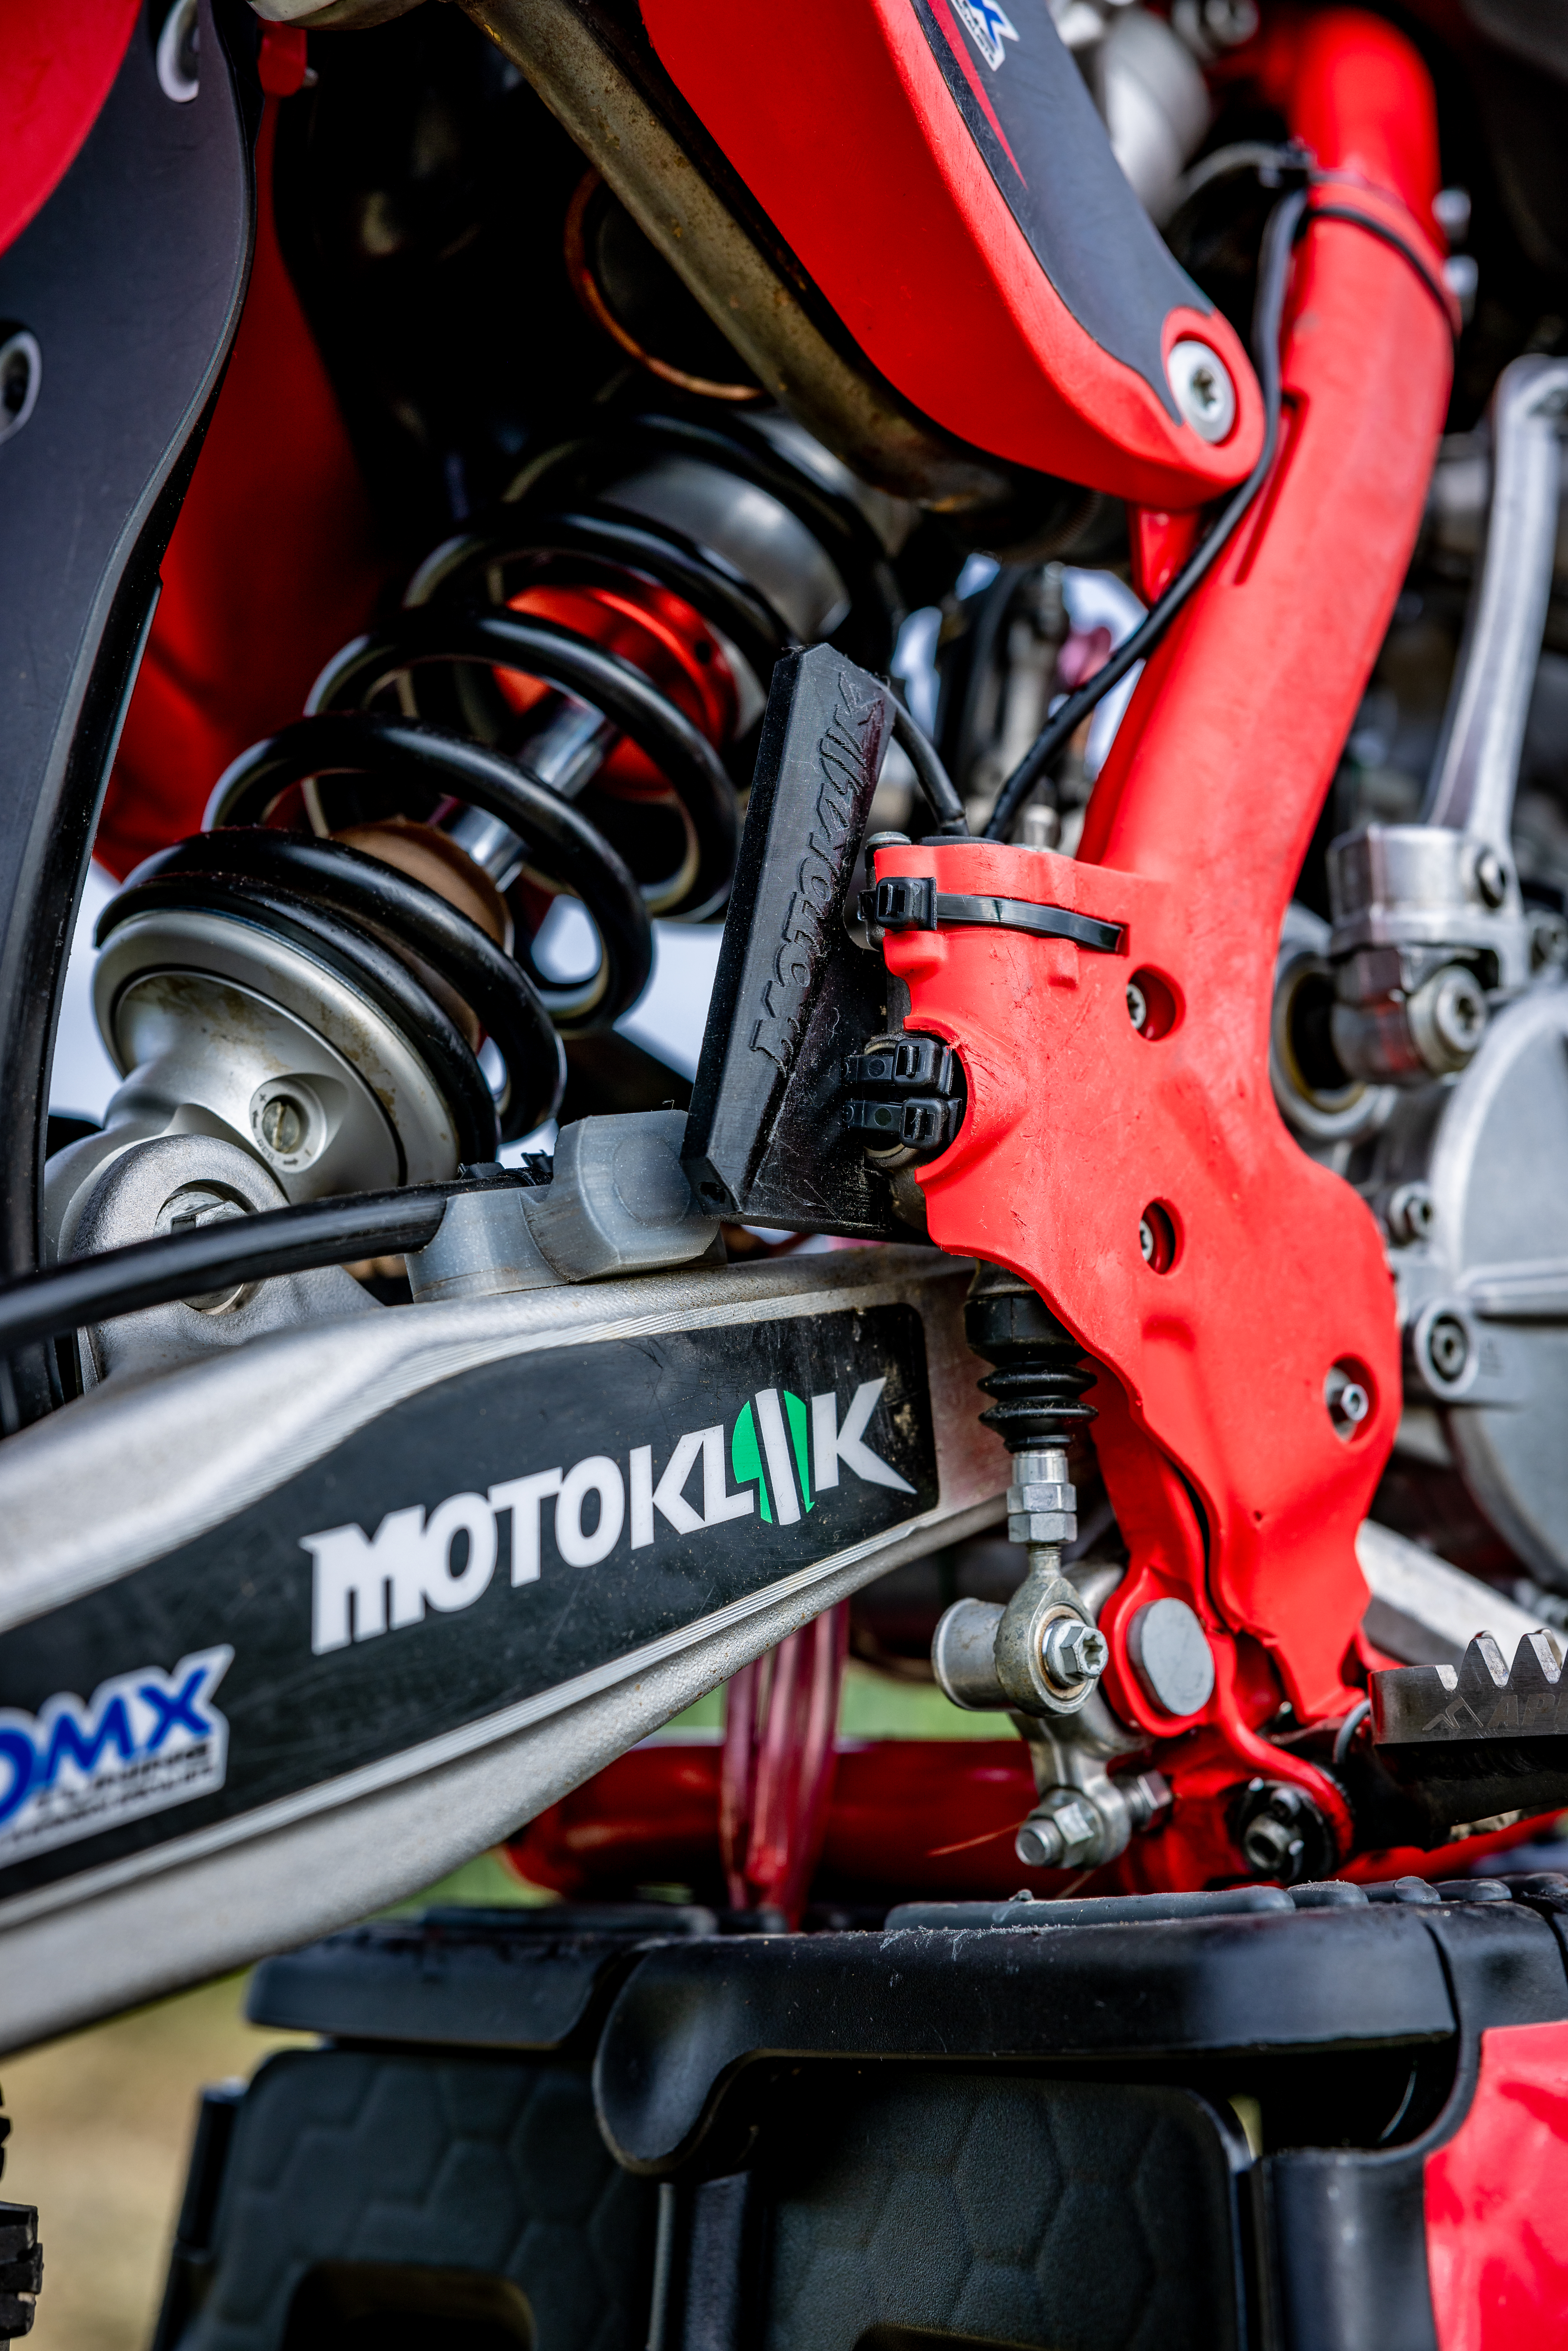
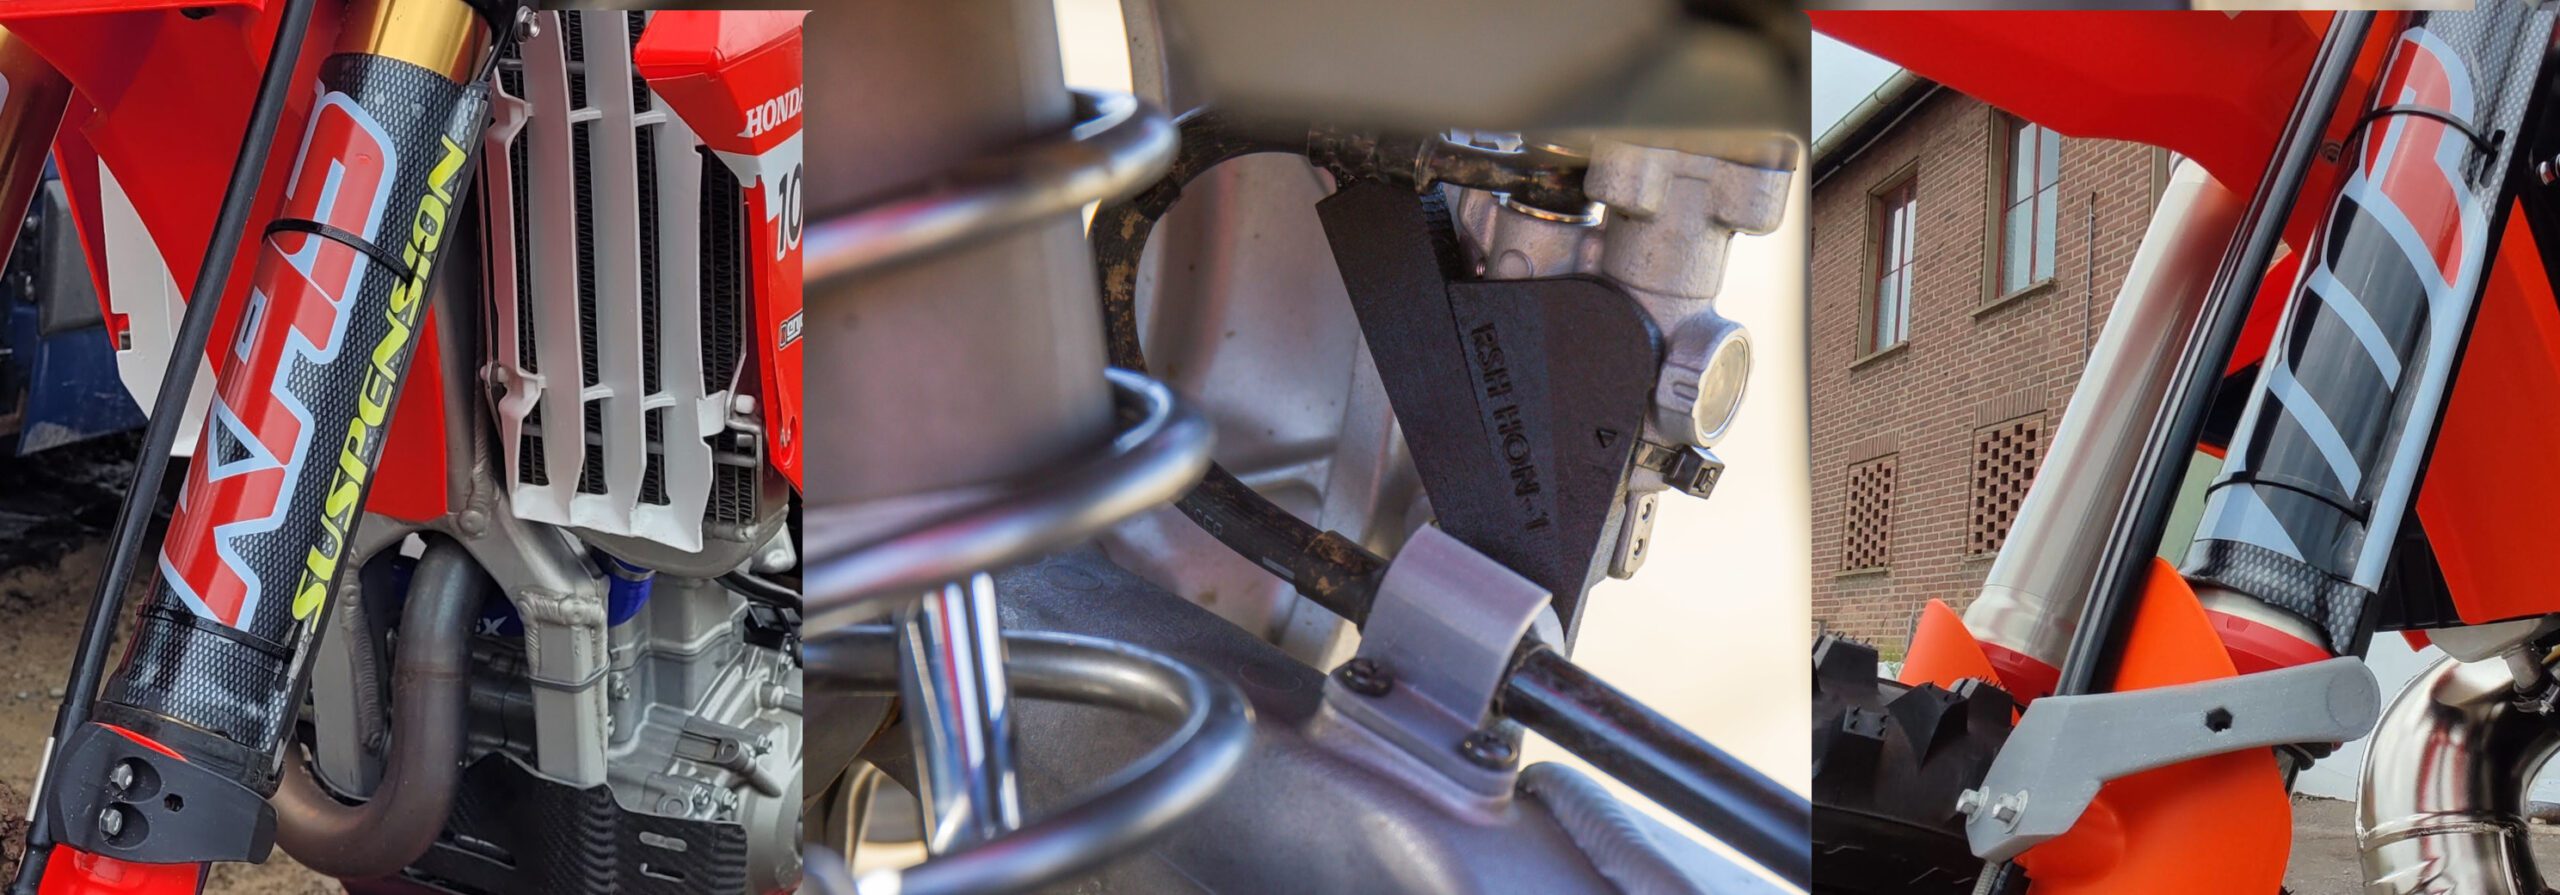
The images above are one’s I’m very proud of. For many months, Ducati have been trusting suspension position measurement to Motoklik sensors. Look closely and you will see our front and rear sensors equipped on the bikes of Cairolli and Lupino. For us as a company, this is very very exciting! To have our products used by a 9x World Champion and such a prestigious brand is a major achievement. I’ve written quite extensively about suspension setup using data, and you can find all the articles on the News page of our website, so I don’t feel the need to go on at length about suspension data here now.

The bottom right picture above shows a satellite position antenna from 2D-Datarecording and a GET rev counter used for having the correct RPM off the start. As the rider looks over the bars at the gate drop, the leds light up when they twist the throttle until they show green, and then the rider knows they are good to go.

As you work your way around the bike, more sensors can be spotted. All 3 shown above are the same type of pressure sensor from Aviorace. By measuring the pressure of the front and rear brake lines, as well as the hydraulic clutch line, you can learn about how the rider rides the bike, and how those behaviours change in different conditions and make adjustments accordingly. For example, you could monitor the precent time a rider has the clutch engaged throughout a lap in different conditions such as sand or hard pack, and use this to decide if a clutch needs to be replaced between motos, or how to change the engine mapping to give the rider more power where they need it.

It can also be used in rider training to see when and how they apply the brakes and if it can be improved. This is maybe a little bit more straightforward in racing on asphalt than in the dirt, but similar principles can be applied. Here’s an example of looking at a “perfect” braking data profile on asphalt.

Finally, we have some sensors more related to mapping and fueling. The lambda sensor on the exhaust is used to measure the amount of oxygen left in the exhaust gasses. Unused oxygen is potentially unused power and you don’t want to leave any of it off the table, especially on the start. It can also be used to adjust the amount of fuel delivered at different altitudes or air pressures as the amount of available oxygen in the air can increase or decrease.

Oil temperature and pressure sensors are used on either side of the crankcases to keep an eye on engine condition. A drop in oil pressure could be a sign that a part has failed inside the motor, while the oil temperature can be used to make sure that there is adequate cooling and the oil isn’t overheating and losing its ability to lubricate and protect engine components.

All of the sensors shown in this article are “extras” from a production model, but further data can be recorded from the ECU such as water temperature, RPM, throttle position, gear position, intake manifold pressure and temperature, mass air flow through the throttle body and so on.

All of this data is only as good as how you can use it though, and therein lies the most important aspect which Dall’Igna alluded to at the start. AI and Machine Learning are enabler technologies which allow an engineer, or end user to turn streams of data from all these sensors into actionable outcomes. A perfect example of this is Motoklik’s AiSetup which transforms suspension data into what to do with the clickers, springs and preload. When you take this a step further in Motorsports applications, the data can be used in full race simulations which can be used to determine which ignition map might be the best, how to trim fueling, how much fuel to put in the bike, and how to valve and spring suspension. Ducati started this in MotoGP back in 2017, so the downside is it takes time to make AI work in Motorsports because of the limited opportunities to gather race data. The thing is though, the sooner you start, the sooner you get there.

No doubt, Ducati will be taking a data driven approach to motocross, as they did in Moto GP, and development of the bike will be rapid as a result.

I hope you enjoyed this article, and you will find many more on our website.

Kind Regards,

CEO & Founder

Jens Köpke

The Physics behind Honda’s new Frame

Honda dropped their new model 450 last month, and from the outside, it doesn’t look as big a jump as we’ve seen in the past, such as in 2017 with the addition of twin pipes, or in 2021 when they dropped the twin pipes and moved much closer to what we have now in 2025. To the average eye, it doesn’t look like much has changed other than some funky new radiator shrouds.


But changes are there, we just need to dig a little deeper to find them.

On Kris Keefer’s website, he points out 5 key changes to the new 450.

  1. Engine: The redesigned airbox provides a straighter pathway for airflow, as well as the revised header pipe design is longer.
  2. Chassis: The meat and potatoes of the 2025 Honda CRF450R is the updated main frame constructed of 70% new components to optimize rigidity and improve handling characteristics.
  3. Suspension: A new shock spring, reservoir, shaft and oil seal contribute to a consistent stroke feel to match the fork updates.
  4. Plastic Crossover: No, your old shrouds and side panels will not fit. You’re stuck with the 2025 plastic scheme.
  5. Brakes: The front brake caliper has an updated piston and seal grooves for consistent performance throughout the moto (fading).

The chassis has been updated to “optimize rigidity and improve handling characteristics”. What exactly does this mean though? To find our answers, we have to jump back into the past and see some of the comments being made about the Honda 450 in 2021 and 2023.

Following the 2023 Houston Supercross, Michael Lindsay from Vital MX spoke with Chase Sexton, and we got some insight into what issues he was having:

“Last year it was really overpowering the front, now it’s overpowering the rear”, “When the track was slicker last year, we struggled a little bit, and this year it felt a lot more stable.”

Interesting! It looks like the changes Honda made, completely changed the characteristic of the bike and shifted the problem from the front to the rear. What I mean is that, the front didn’t just improve a little bit, but the rear actually became worse, presumably caused by over compensation. This is quite normal when working through the trail and error of rider feedback, and what’s good is that the engineers at Honda were actually able to alter the bike in a way that could directly target the area where Chase felt the issue i.e. the front being over-powerd.

The Motocross Action Magazine Real Test of the 2021 Honda CRF 450 R had this to say when it was first released:

“Lateral rigidity has been reduced a remarkable 20 percent, which can be felt in everything from line choice to directional changes to accurate wheel tracking…. No doubt about it, the 2021 Honda’s more conservative powerband, flexier frame and spot-on ergonomics will make every loyal Honda CRF450 rider a happy camper… It is possible to have too much of a good thing. For some unknown reason, Honda’s engineers steepened the head angle by 0.5 degrees, ostensibly to make the CRF450 turn-in better…. When you combine the steeper head angle with the soft forks and aggressive braking, you get a bike that dives. The dive steepens the head angle way beyond common sense. This tacks the CRF450’s front tire to the ground so well that the frame hinges in the middle and the rear end steps outs….”

I like these reviews from MXA, because they really do put the bike through its paces over months and give real world feedback on the bikes in stock form. If you’re wondering, “Lateral rigidity” is the ability of the frame to resist bending between the headstock and rear axle. Imaging grabbing the frame in the picture above with one hand on the headstock, and one hand on the axle pivot, and you’re trying to bend it so that the headstock touches the rear axle pivot, and as you look down on it from above you see a “U” shape. The force acting against you there is lateral rigidity. The issue is though, that many of Chase Sexton’s crashes in the 2023 season were due to washing the front, how could this happen on a bike that has so much front wheel traction, it will throw the rear out?

If MXA’s comments are correct, that the head angle was too steep, and the forks were too soft, then this leaves the factory HRC team with a problem because of the AMA’s production rule  where it states that “Material may be added to the production frame or swingarm for strength, including welding. These changes shall not affect frame geometry.” It is guaranteed that the HRC riders will use much stiffer forks and shocks than production, and will also look to change the head angle through adjustments to the fork clamps. This extra stiffness coupled with the “20%” reduction in lateral rigidity would mean that the frames ability to resist the forces put on are greatly reduced from the previous model, and so would “overpower the front” of the motorcycle as per Chase Sexton’s comments. 

To maintain maximum grip with the track, the tires need to be pushed down into the ground. This is fairly straight forward when accelerating in a straight line because the motorcycle squats on the back and puts a lot of weight down through the rear tire. The same is needed for the front, but when you have a bike with really stiff forks, and a frame that’s happy to bend out of the way, it could cause a problem when leaning in a corner. When a bump is hit on lean, rather than the suspension compressing further and putting more force into the tire to maintain grip, the frame will bend away, when the front tire travels over the bump, and on the back side, the frame may not be able to react quick enough to return to its usual position and so the tire loses more grip. As a result, you could have those Chase Sexton type washouts.

So what did Honda do?

Remember in the AMA’s production rule it said “Material may be added to the production frame or swingarm for strength, including welding.”? Well that’s exactly what Honda did. On both sides of the down tube, Honda welded in two plates all the way from where the perimeter spars butt against the headstock, to the point where the down tube meets the cradle spars.

This update would stiffen the front end of the motorcycle mainly in lateral and torsional direction vectors which would undo their work when they launched the bike in 2017.

You can watch more about this at 02:54 on Vital MX’s Pits Bits from February 2023.

Ok, problem fixed right?

Well not really. According to Chases interview from the same time in February, he said that the motorcycle is now over powering the rear. What this means is now there isn’t enough give in the front of the chassis, so that more force is being directed at the rear of the bike and into the shock.

In the end, this is where we end up. The image above shows the 2025 Honda CRF 450 R frame. According to Kris Keefer the “New subframe mounting point optimizes lateral rigidity and reduces energy transmission from the rear of the bike to the front. The rigidity of the steering stem, triple clamps, outer fork tubes and front axle have all been revised to match the frame updates.”

The picture above shows the 2024 CRF 450 overlaid on top of the 2025 model, and the new mounting point as well as the longer exhaust header are clear to see. I believe the subframe mounting point actual helps reducing the energy transmission to the rear more than anything. The reason being that if you were to look down on the frame from above, the sides of the triangle shape drawn from the headstock to the subframe points are longer, and when we push down on the point of the triangle, it is easier to bend the sides out of the way i.e. the perimeter spars, and so less energy is put into the rear shock.

What really stands out though is how few changes there are compared to the big jumps seen in previous 4 year cycle model changes from Honda. In the past, you could easily tell that it was a new or old model, but now without the change to the radiator shrouds, you would have to look a lot closer. This to me tells a bigger story.

During the COVID pandemic, dirt bike and powersports sales went through the roof, driving manufacturers to ramp up production. Delays in deliveries (remember the container ships queued outside San Diego as well as the container shortage) meant that stock was building up in warehouses and couldn’t be sold. This left manufacturers with a lot of stock on hand, and I could nearly guarantee you that there is a warehouse somewhere in the world packed with CRF 450 engines. What I believe happened is that Honda decided to make relatively minor changes to a 4 year cycle motorcycle in order to use up existing stock, but also to consolidate efforts on the new CR-E, but that’s a story for a different day.

Hope you enjoyed this article!

Kind Regards,

Jens

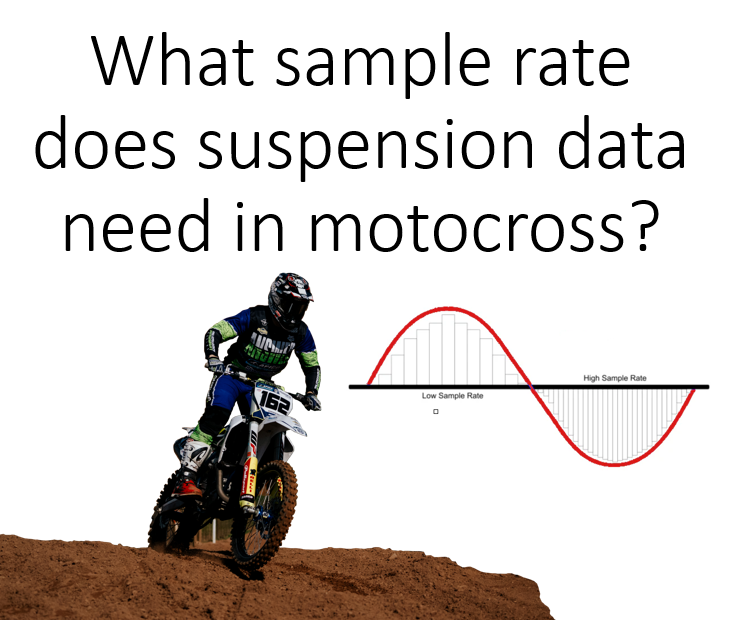
What sample rate do you need?

Is there a “right” sample rate for measuring suspension movement on the track?

There are many different opinions on the matter, and this video we take a look at our approach here in Motoklik and show the reasoning behind why we do what we do.

Should you be able to “feel” clicker changes?

When we turn a clicker in, we stiffen the damping, and when we turn a clicker out, we soften the damping. This has an equal effect throughout all stroke speeds, right?

Yes, in an ideal world, there is usually a constant increase or decrease in force needed to move the suspension across the speed range that the suspension moves at.

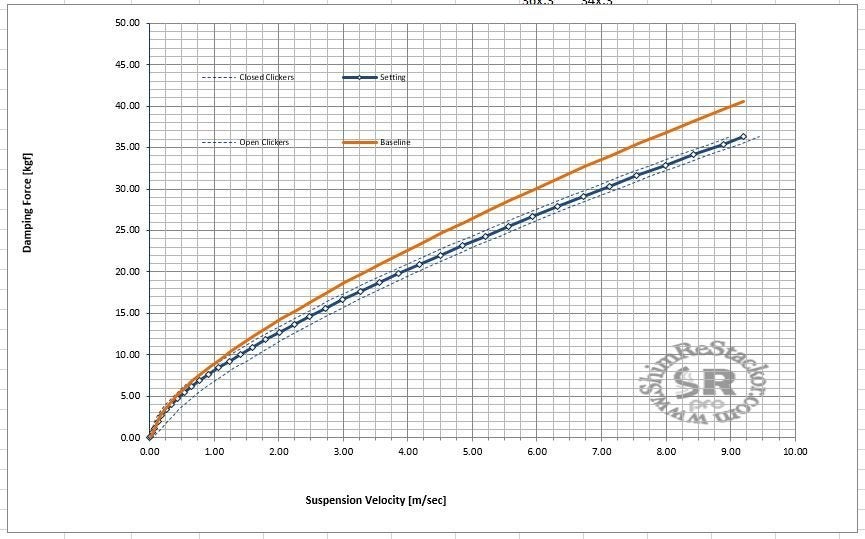
Take a look at the example below. The blue dotted lines either side of the solid blue line show the force measured across varying speeds with the clickers closed (top dotted line) and clickers open (bottom dotted line). We can see from the graph that the change in the damping force across the speeds is pretty much the same, around 0.5kgf (except for at very low speeds where the force starts from 0).

(The image below is from a Thumper Talk post, but the graph appears to be from Shim Restackor.)

I believe most average riders think that by turning the clickers, they will be able to solve any of the issues they are having on the track, regardless of how fast the suspension is moving, because the clickers have the same impact all the way through the different speeds.

This isn’t true.

I often see it being said that riders should be able to “feel” everything that happens on track and relay that back to their suspension technician or team, but here’s the issue; the faster the suspension moves, the more difficult it is to feel the clicker changes.

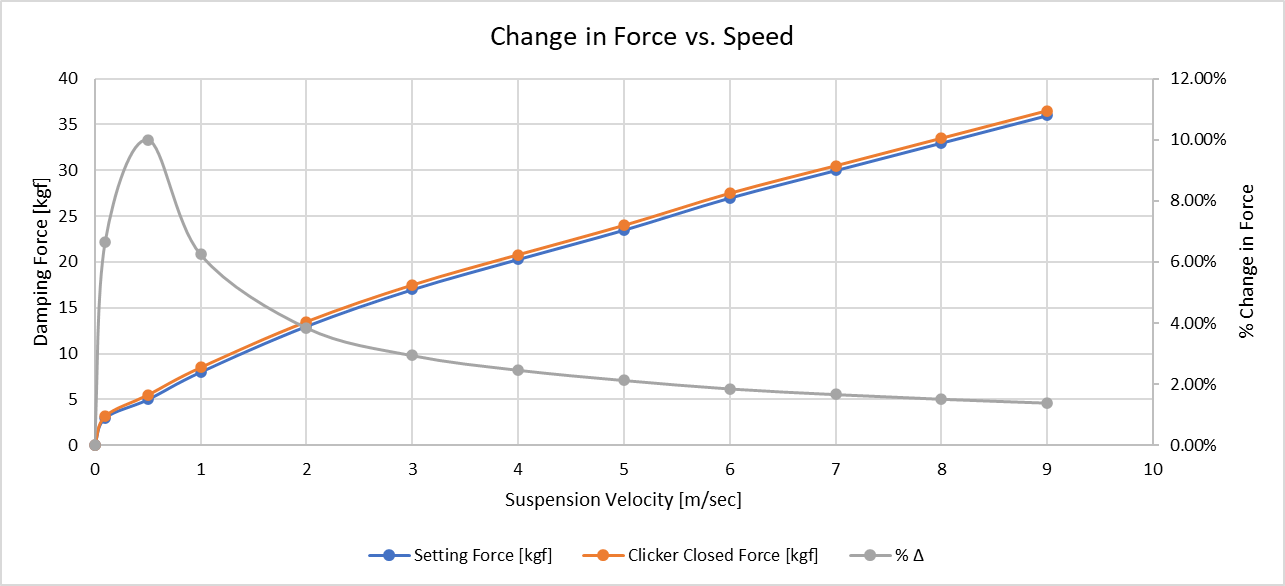
The graph below uses the data from above, and shows the percent change in force as the suspension moves faster. This is represented by the gray line. At low speeds (less than 1m/s), the change is quite substantial at nearly 10% for speeds of 0.5m/s. Thereafter though, the percent change drops off quite quickly, and by the time it get’s to 3m/s, there is only a 3% change in force. What does this mean in terms of feeling?

I want you to imagine we fill a bucket with water, and it’s left out on a bench in front of you. In the bucket, there is a flat plate with a handle attached sticking straight up from the bucket. There is space left all around the plate, so that the water can flow past the edge of the plate and the walls of the bucket. Move the plate up and down with the handle, and you will get a feel for the force of the water acting against it. Now, replace the water with maple syrup. It’s a lot tougher to move right?

The viscosity of water is 0.01 poise, and the viscosity of maple syrup is around 0.05 poise, so it takes 400% more force to move the plate in the bucket with maple syrup. That’s why we can easily feel the difference.  If the water were 3% more viscous, it would be 0.0103 poise. How could we possibly feel that?

OK, so what, I can see a 10% difference there in the graph as well and surely that’s what the rider is feeling?

Let’s take a look at some real world data.

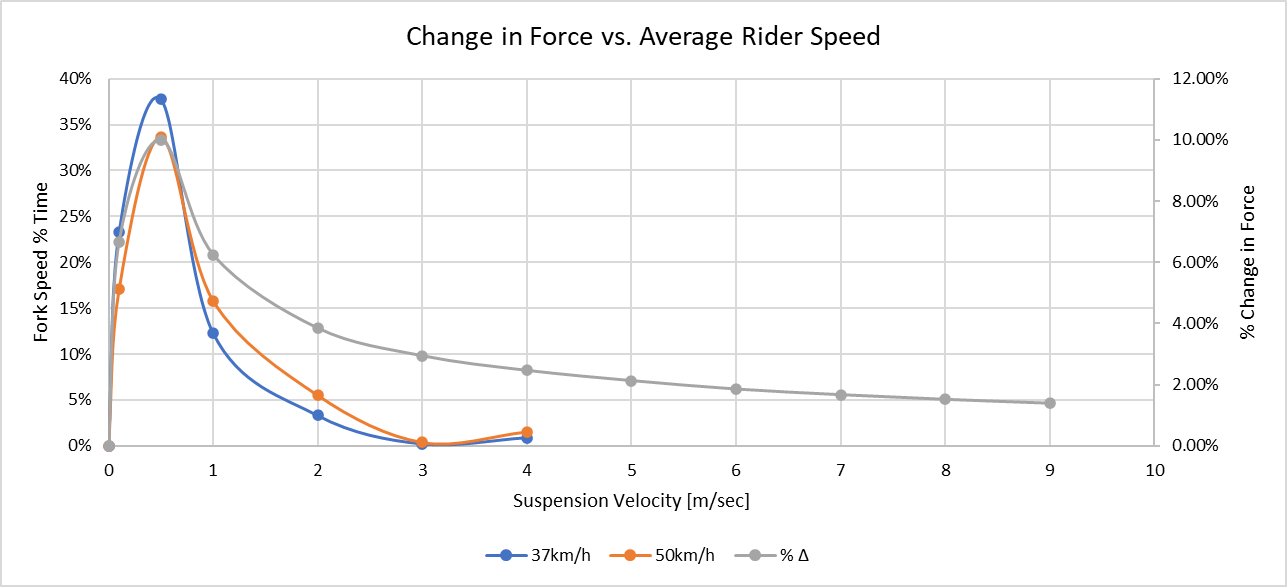
The graph above shows the percent time the forks spent at different compression speeds for two different riders. One rider had an average speed of 37km/h (blue line), and the other rider had an average speed of 50km/h (orange line). (No, they weren’t on a Yamaha and a KTM, that’s just a happy occurrence from Microsoft Excel’s colour choice 😅)

Ah ha! The peaks of the graphs line up!

What this means is that most of the time the suspension is moving at around 0.5m/s, which matches up quite nicely with the peak change in force from the clickers. This is probably no coincidence, as the decades spent developing suspension from orifice style damping to closed cartridge would have been driven mostly by rider feel, and thus, the biggest effect from clickers happens at the speed the suspension spends most of its time at. You might have also noticed that the faster riders suspension spends less time at the lower speeds, and more time at the higher speeds, meaning that faster riders will need to be more sensitive to feel the clicker changes.

That’s a delightful way to end our story then right? We can just cure all riders problems with clickers?

Eh…. no.

There are two things that we need to account for.

1. The suspension can still move at really high speeds up to 9m/s where the rider will find it incredibly difficult to feel the clicker changes. (We usually see this when landing from a jump, or hitting a really square edge hole) .

2. The damping force may just be way off, and you’ll never get to where you need to be with the clickers alone.

We’re on to the final stretch, bear with me!

Let’s take one last look at the first graph, and something we haven’t spoken about yet, the brown line. You might have noticed it is labeled as “baseline”, and the blue line is labelled as “setting”. What this means is that the technician has made a change to the shim stack layout of the valve in order to reduce the force from the original setting. E.g with the baseline at 5m/s, there was a force of 26.5kgf, but with the new setting the force is reduced to 23.7kgf, meaning the fork would feel softer.

With this configuration of clicker, you were never, ever, ever going to get that much of a change, so if the rider had an issue with a harsh feeling on square edge bumps, or bottoming of the fork, it was going to need a valve adjustment.

I have to caveat all of these articles with the fact that in the real world, things rarely behave in an ideal manner, and you will see differences in behaviour from clickers and valving configurations. Like maybe the clickers stop having an effect at higher speeds, or they have more of an effect at lower speeds, and all this can be seen through dyno testing.

Hopefully though, you will see how using the Motoklik system, and the AiSetup can benefit your riding. There is a lot to be had from the clickers (up to 10% performance improvement based on this example!), and the beauty of it is, that Motoklik will identify if your suspension can be improved even further by either running you out of clicks, or by showing that the overall characteristic is too soft or too hard, in which case you will need to call on your local friendly suspension technician.

I hope you enjoyed this read, and you will find all our articles on the News section of our website!

If you’d like to work with us and the Motoklik system, feel free to email info@motoklik.com

Kind Regards,

Jens

Ahhhh the robots are coming! AI for Suspension Setup

When the Jacquard loom of 1801 was introduced to factories in France, it was met with public outcries of opposition where “People smashed the machines” and even “killed textile mill owners”.  While the measures the protestors went to were extreme, their thought process had some basis: “this bloody machine is putting me out of work!”. This loom, alongside the steam engine and carbon steel formed the building blocks of the industrial revolution and the world had access to more items at a lower cost than ever before.

In todays world with all of the advances we have in technology, we have more people working better jobs, and with better health, than ever before.  So, what should we do when a new technology comes along that challenges the status quo?

Artificial Intelligence (AI) is making us look at the Jacquard loom all over again. When the words “Chat GPT” first appeared in the news, there was a lot of speculation on how many people would lose their jobs as a result, and how terminator was now real and our civilisation is doomed to extinction when the robots take over. But, what is AI?

The best definition I have come across is from IBM’s, Jeff Crume. Jeff states that “AI is basically exceeding or matching the capabilities of a human”.  That’s it. No robot takeover, no subjugation of humans, just the ability of a machine or software to match the capability of a human.

A practical example of this is determining the price of a car. When we see a 4 door saloon (sedan) car with an Audi or Ford badge of a certain year, we can have a rough guess as to what the price of the car is. If we work as a car sales man, we can give an even more accurate guess, but if we were either of these people we would still have to do more research to come up with as accurate a price as possible. This becomes more and more difficult as you start to take more factors into account; is it petrol or diesel, what colour is it, how many miles are on the clock, what’s the service history, has it been crashed, how many previous owners are there, does it have a leather or cloth interior, aircon etc. etc. The human mind can find it very difficult to take all these factors into account. But not AI. With enough data, an AI model can be trained to give immediate, accurate answers no matter what car you ask it about. Don’t believe me, try to beat Microsoft Azures Automobile Price demonstration model.

So what does this mean for the the world of suspension setup?

We first need to specify how suspension is currently set-up. There are three options available:

1. “Feel” what’s happening and use your experience to make spring and damper adjustments.

2. Have an experienced suspension technician watch you, and combine it with your feel feedback to make adjustments.

3. Manually interpret suspension data, work with an experienced suspension technician, and combine it with your feel feedback to make adjustments.

These three options are similar to guessing the price of a car. Using your “feel” is guessing on your own, working with a technician is a sales man guessing, and using data is the sales man doing research. We’re limited on the number of factors we can take into account because the human mind is limited in how much data it can retain.

Before we go any further, don’t @me with comments like, “he said suspension technicians are just car sales men.” I am ABSOLUTELY NOT saying that. Suspension technicians and data analysts spend years of their life gaining experience and working with riders to build up unbelievable skills, in the same way a weaver could weave magnificent patterns before the loom.

When faced with the immense power of AI however, it’s difficult to see how a single mind, or a small group of human minds can compete, in the same way the weaver had to compete with the loom.

Motoklik’s AiSetup is built with the objective of recommending clicker adjustments, and highlighting if there is an issue with the springs or valving. It’s specifically designed to work with suspension that use shim stacks to control the flow of oil in the damper. It does this by using a database that we have built up with years of testing across numerous types of tracks, riders, makes and models of motorcycles and suspension, to make accurate predictions. Our database is like all of the car details that feed into the car pricing model explained earlier.

Does this threaten the job of the suspension technician?

Yes, and more importantly no.

Some suspension technicians pride themselves on track side support, and attend tracks every weekend. Others want to spend time with friends or family and don’t need the phone hopping all weekend with “Trevor” asking what way he should go with his clickers because his bike feels kicky on the way into the back left turn at xyz track.

Regardless of which type of suspension technician it is, the most benefit for riders comes from suspension service work, and required re-valves or kit suspension. This is the bread and butter of the suspension technician, and is complemented by Motoklik and AiSetup. Clicker recommendations can help riders on the weekends, and any issue with valving or springs can be corrected by technicians during the week. Add in Motoklik’s built in hour meter, and riders can know when it’s time for a suspension service (we estimate 20-25 hours on the forks, and 40-50 hours on the shock.)

Does AI still sound so scary? I hope not. Humans have always been advancing technology, from stone axes to quantum computers. As long as technology has improved, so too has the life quality of humans.

If you are interested in working with the Motoklik system, feel free to email info@motoklik.com 🙂

Kind Regards,

Jens

Professionelle Datenanalyse- und Fahrwerks-Einstellung via App!

Motocross Suspension Data Logger for 85cc Motorcycles

Gestern noch unvorstellbar – heute für Jedermann in Echtzeit verfügbar! /// MADE IN IRELAND!

Motocross Suspension Data Logger for 85cc Motorcycles

Kaputte Strecke, dicke Arme, unkonstante Rundenzeiten, unvorhersehbare kleine Stürze, fragende Blicke. Hier ein Klick, da eine Drehung an der Federvorspannung und eine Stimme aus dem off die irgendetwas von „Highspeed“ faselt. Nach einer Stunde muss Dr. Google mit dem Standard-Setting behilflich sein weil irgend jemand „erstmal alles auf Standard“ kommentiert hatte.

Verzweifelte Anrufe beim „Fahrwerks-Guru“ des Vertrauens der zwar fasziniert deiner wirren Beschreibung des Problems lauscht aber per Ferndiagnose auch nur einige Standard-Vorschläge machen kann. Der „Kriegsrat“ aus Freunden und Familie tagt erneut und diskutiert, wild gestikulierend wie man es aus diversen MX-Videos kennt, wann und wo du schnell oder zu langsam warst. Welche Entscheidung deine Spurenwahl vermeintlich optimieren könnte und vor allem: Wie hat das Fahrwerk „gelegen“ und welchen Impakt hatte es auf die die vorherigen Diskussionspunkte! Dir brummt der Kopf, du hattest eine Frage und hast nun 5 Meinungen.

Du denkst an die bekannten MXGP-Fahrer. Ein Fahrwerks-Experte vor Ort, der kilometerlange Wanderungen um die Strecke unternimmt um die perfekte Fahrwerksabstimmung bereithalten zu können. Mechaniker, die Rundenzeiten und Fahrtechnik im Blick haben. Die Vergleiche hinsichtlich der Spurenwahl und Abschnittsgeschwindigkeiten der Vorrunden beobachten- und vergleichen um zusammen mit dem Trainer oder Teamchef die perfekte Empfehlung abgeben zu können.

Eine perfekte Umgebung um schnell Motorrad zu fahren die dir, als „ambitionierten Hobbyfahrer“ wie es heute so schön heißt, wohl nie zur Verfügung stehen wird. Mit dieser Annahme liegt man stand heute aber komplett falsch. Jens Köpke von Motoklik Suspension aus Kilkenny in Irland behauptet all das in ein paar kleinen Boxen für Jedermann bereitstellen zu können und MOTOCROSS-MAGAZIN DEUTSCHLAND meint„Er hat auch schon geliefert“!

AiSetup™ von Motoklik Suspension analysiert automatisch eure Fahrwerksdaten und vergleicht sie mit Hunderten von Stunden guter Setups, um euch auf jeder Strecke das beste Setup zu bieten. Wie genau funktioniert dieses System und was bietet es alles? – DAS erfährst Du in diesem Artikel. MOTOCROSS-MAGAZIN Technik!

Motoklik AiSetup Logo

Motoklik ist ein benutzerfreundliches, einfach zu montierendes, robustes Federungs- und Rundenzeitmesssystem für den Einsatz im Motocross-Sport.

Die vom Motoklik-Gerät aufgezeichneten Daten werden über Bluetooth auf die mobile Motoklik-App heruntergeladen. Die App verfügt über 6 Grundfunktionen:

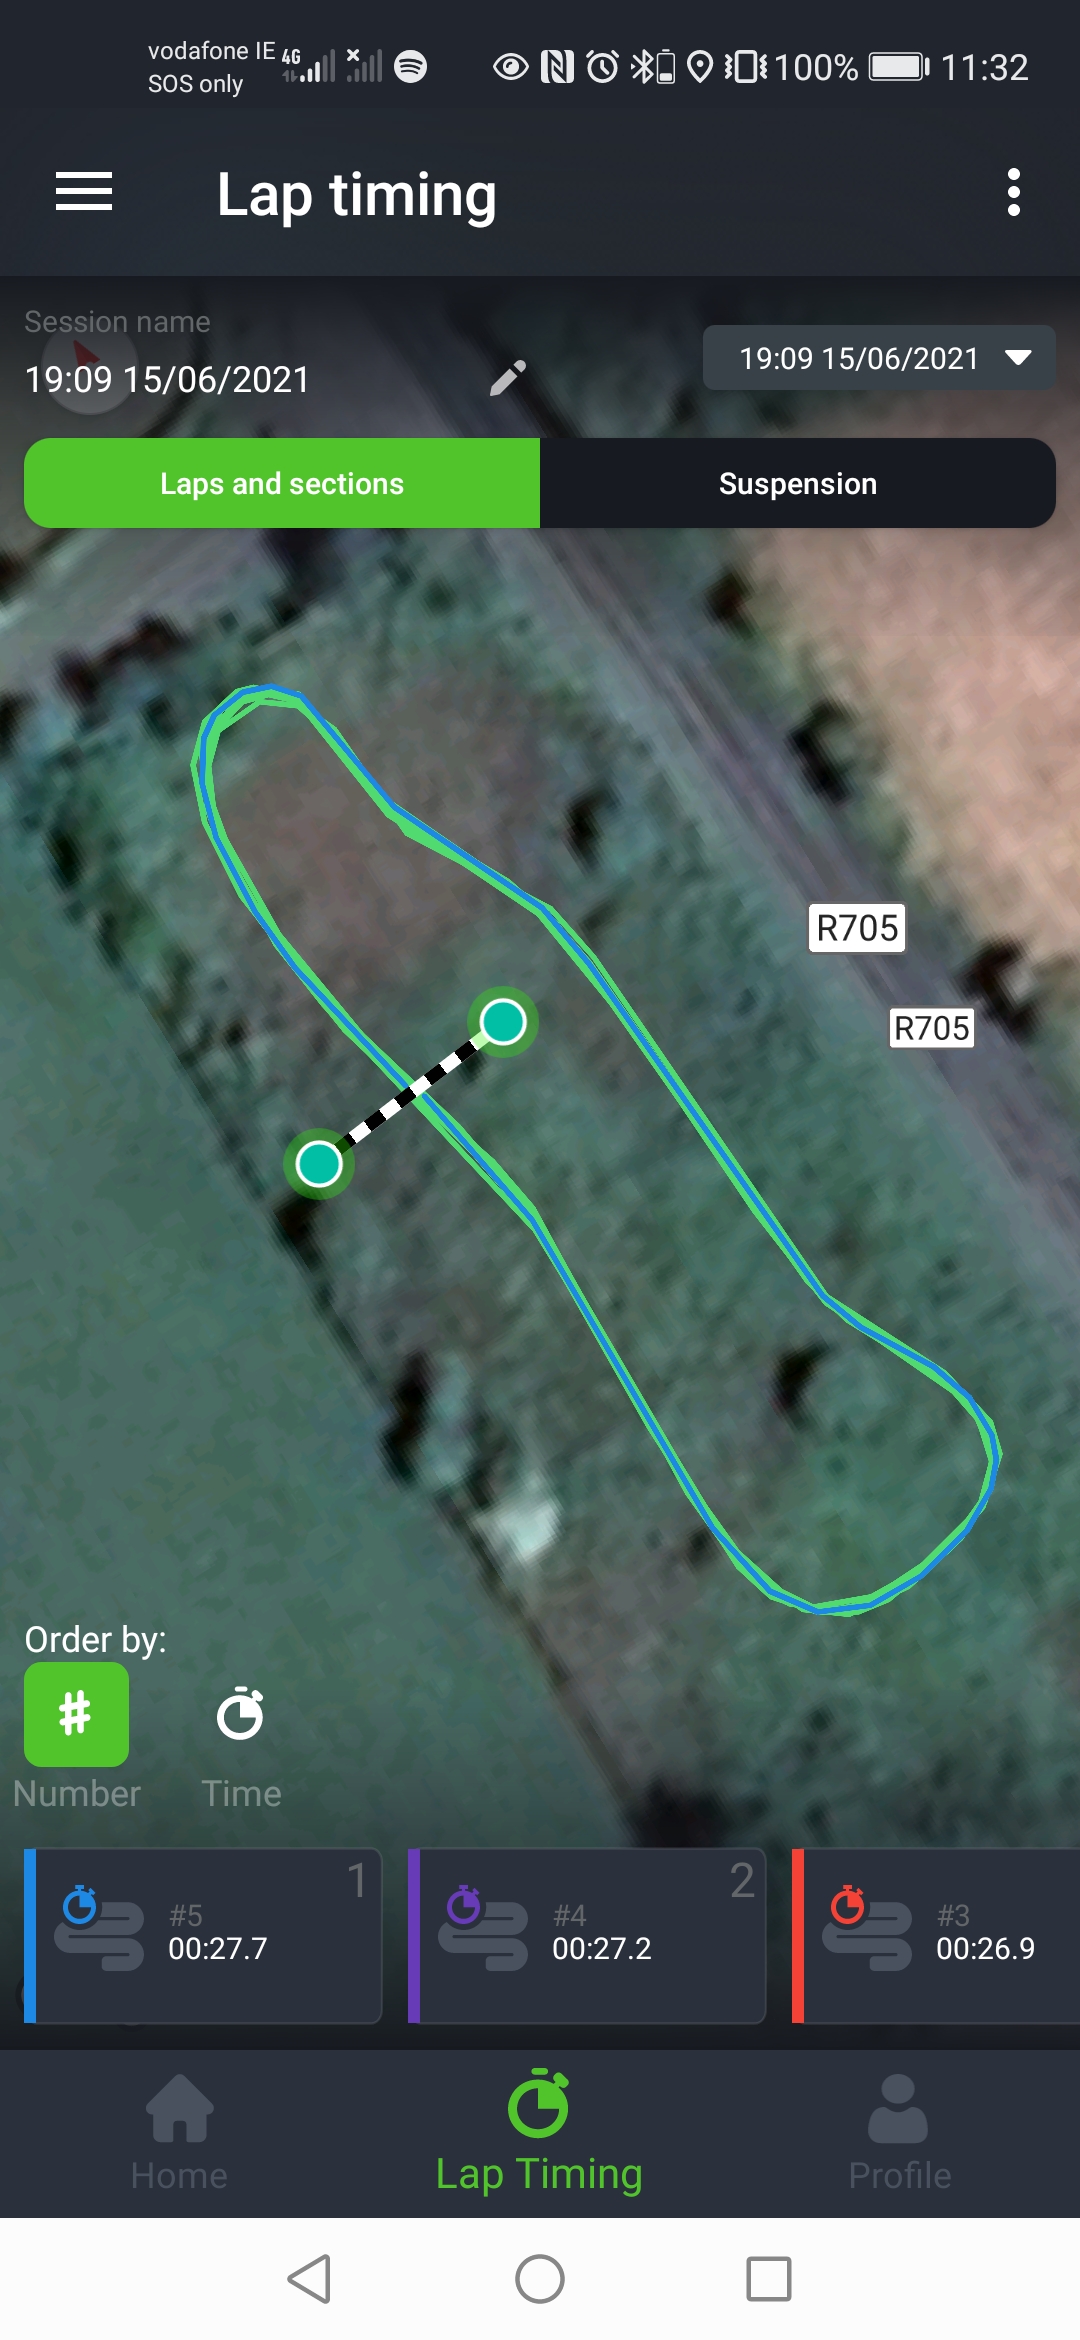
• Lap-Timing-Analyse, berechnet aus den Satellitenpositionsdaten
• Aus Satellitenpositionsdaten berechnete Abschnitts-Timing-Analysen
• Daten zur Position von Gabel und Dämpfer
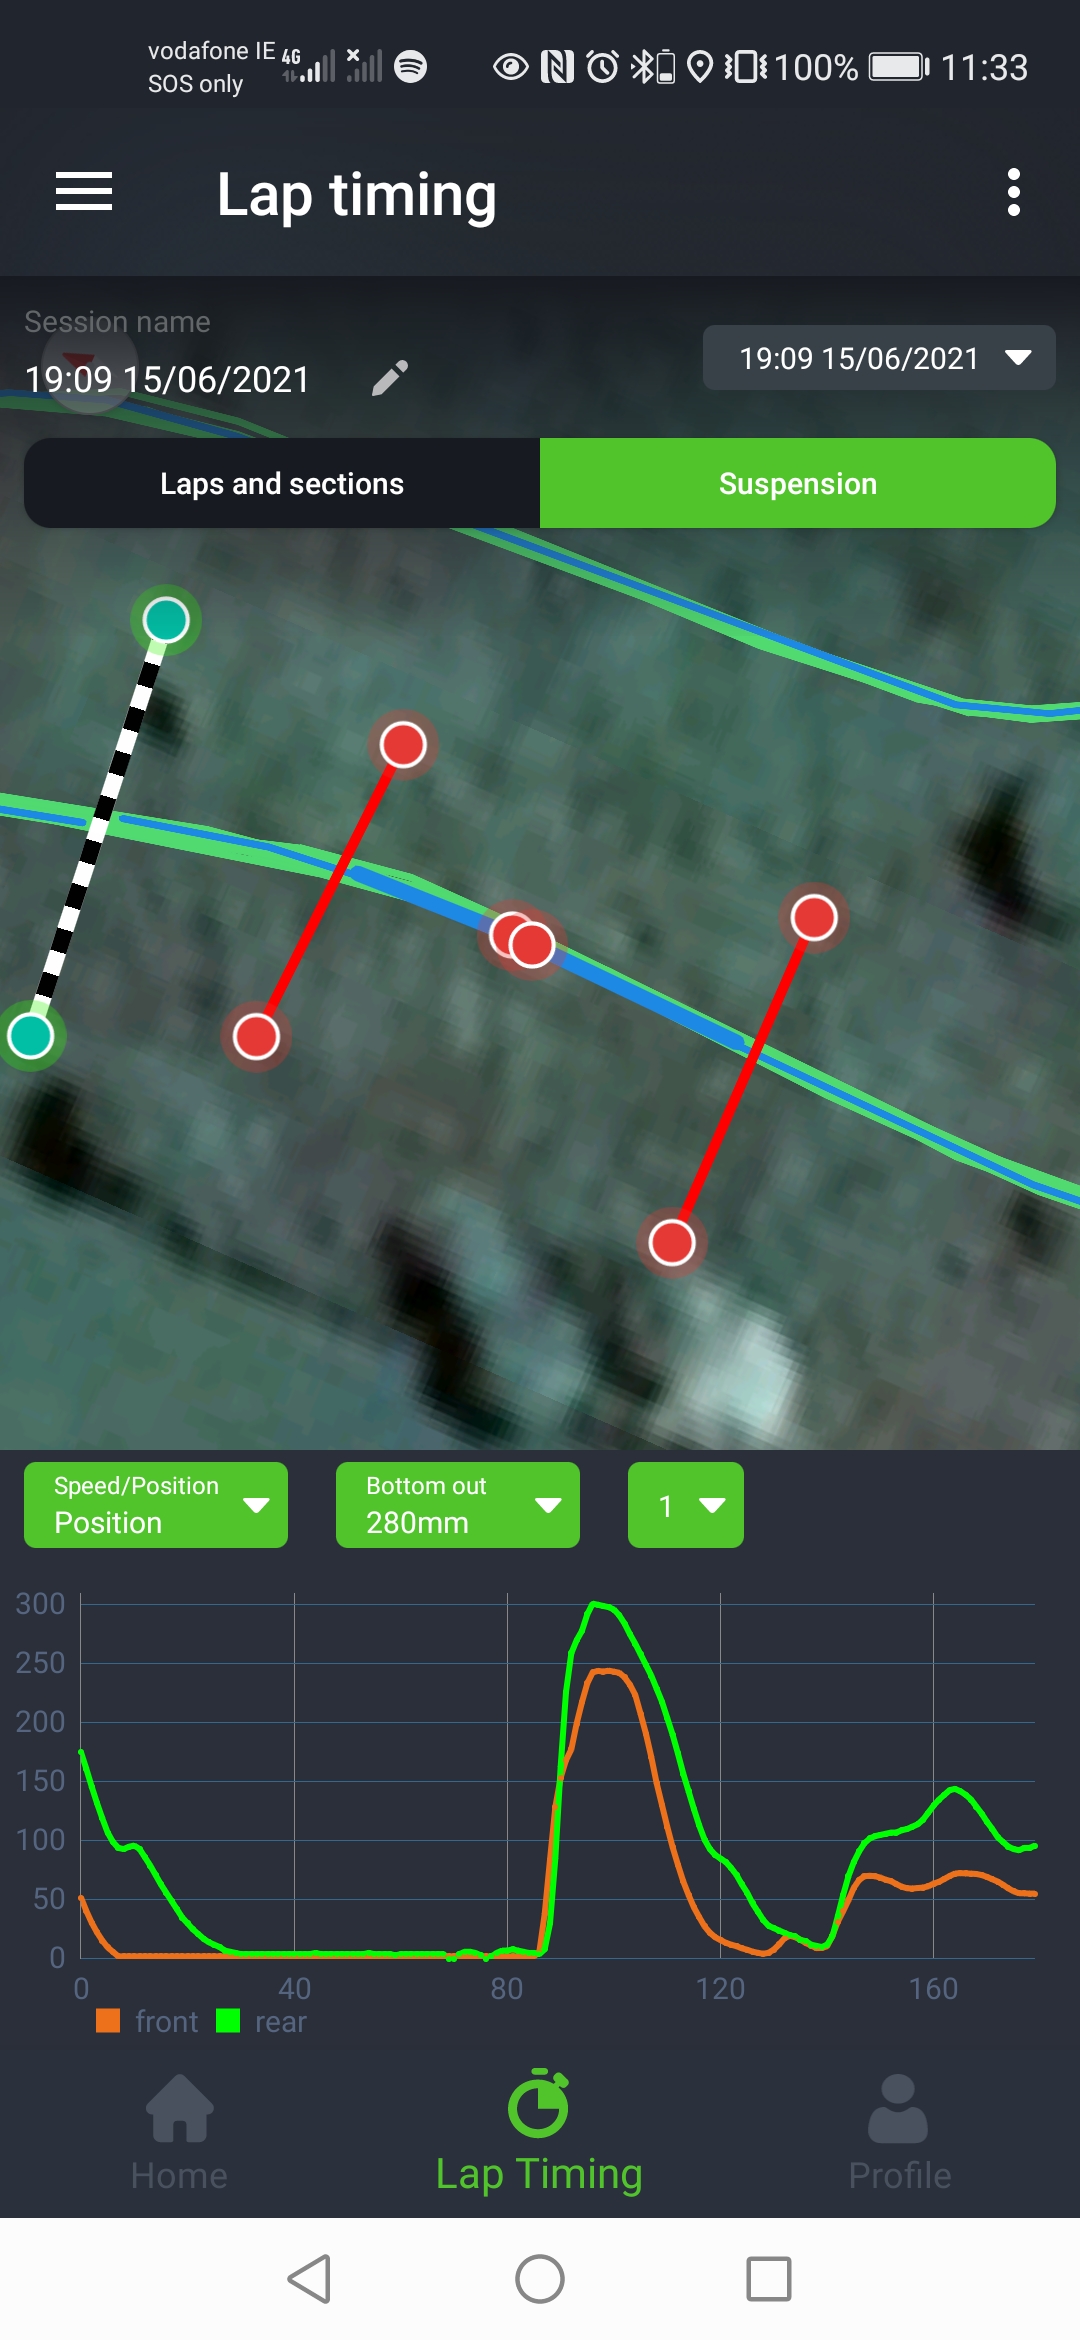
• Durchschlagserkennung, um festzustellen, wo auf der Strecke das Fahrwerk den größten Teil des verfügbaren Federweges nutzen muss
 Durchschlagsanalyse, um festzustellen, ob ein Problem mit der Gabel oder dem Dämpfer vorliegt und mit welcher Geschwindigkeit sich die Federung bewegt
 Live Durchhang-Messung mit welcher der Benutzer das Arbeiten von Gabel und Dämpfer in Echtzeit überprüfen kann

Motoklik umfasst außerdem ein cloudfähiges Online-Dashboard für die erweiterte Analyse von Fahrwerksdaten.

Motocross data logger app suspension bottoming analysis view
Motocross data logger app lap time view
Motocross data logger app live sage value readout

AiSetup™ empfiehlt dir nach der Analyse, wie viel Klicks für Druck- und Zugstufe sowie für High- und Lowspeed der Druckstufe des Dämpfers eingestellt werden sollten. Damit Ihr Euer Bike mit maximalem Vertrauen bewegen könnt!

GateDrop.com Tested: Motoklik – the ultimate suspension set-up tool!

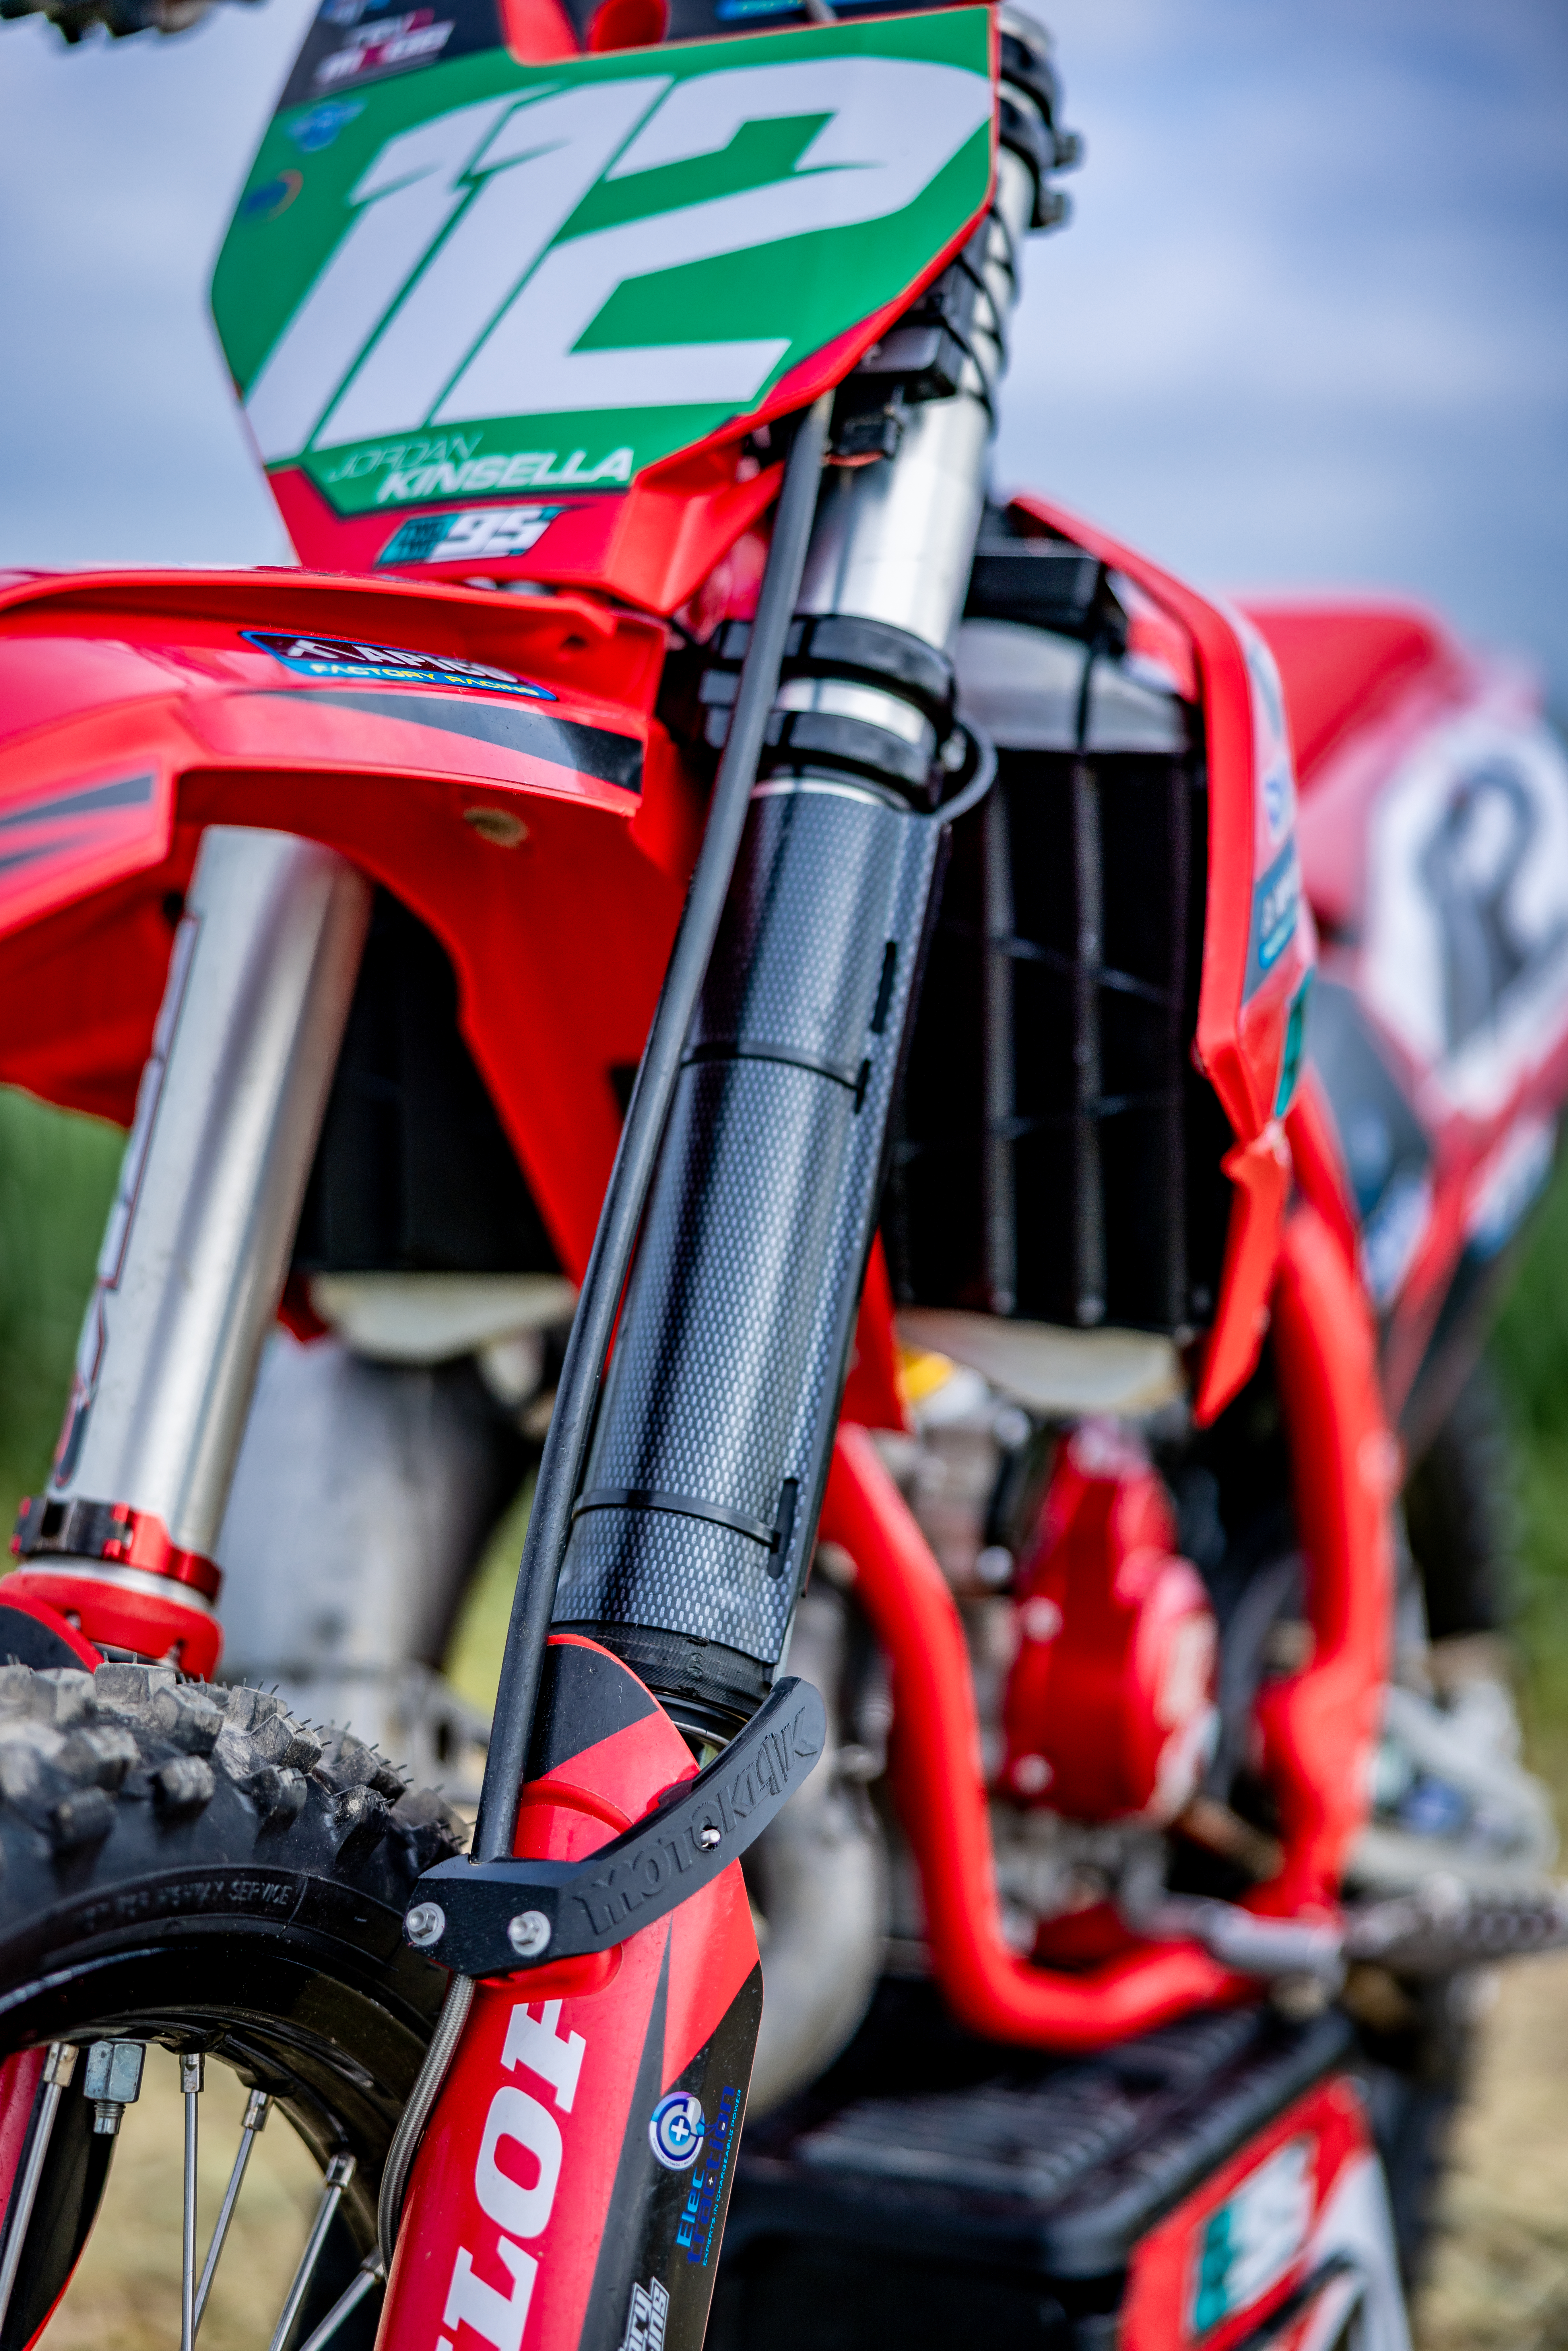
Motoklik ist einfach zu bedienen, einfach zu montieren und robust. Es verfügt über eine zentrale Steuereinheit (CCU), die sich zwischen den Gabelbrücken hinter der Startnummerntafel befindet, eine Satellitenpositionsantenne am Lenker mit einer Start-/Stopp-Aufzeichnungstaste und einer LED-Farbanzeige sowie einem Messstab für die Gabel, welcher sich am linken Gabelholm befindet und eine Messeinheit für den Dämpfer, welche sich zwischen Rahmen und Hauptbremszylinder befindet. Alles lädt sich über die Stromversorgung des Motorrades selbst auf, sodass man sich keine Gedanken über einen Batteriewechsel oder einen Aufladevorgang machen muss.

Die Installation ist für jeden machbar!

Sobald die Sensoren eingeschaltet sind, kann alles auf dem Smartphone erledigt werden und man erhält bis zum letzten Klick Informationen, wie genau das Fahrwerk eingestellt werden sollte – von hartem Untergrund bis hin zu Sand. Die Sensoren am Bike verfolgen alle Werte über die Rundenzeiten und liefern so detaillierte Informationen wie die relative Geschwindigkeit basierend auf der Beschaffenheit der Strecke. Dabei werden Vergleichswerte zu vorherigen Runden ermittelt. Eine beeindruckende Innovation.

AiSetup ist eine intelligente Funktion, die deine Daten analysiert und dir sagt, wie viele Klicks für die Druck- und Zugstufe gedreht werden müssen und ob du den Low- bzw. Highspeed der Druckstufe am Dämpfer anpassen musst, damit du dein Bike stabil in einem schnellem Tempo fahren kannst. AiSetup benachrichtigt dich auch, wenn eine Abstimmung der Dämpfungskennlinie durch Neubelegung der Shims notwendig wird oder die Federn für dein Gewicht und deine Fähigkeiten zu weich oder zu hart sind, sodass du weißt, ob du zu dein Fahrwerk von deinem Fahrwerksspezialisten anpassen lassen musst.

Mit Motoklik kannst du außerdem die Durchhanganzeige in Echtzeit, die Durchschlagsanalyse, die Positions- und Geschwindigkeitsanalyse von Gabel und Dämpfer, die Abschnittsanalyse, die Durchschnittsgeschwindigkeit, die Rundenvariation, den Geschwindigkeits- vs. Streckenbeschaffenheits-Score und vieles mehr sehen.

Motoklik ist nicht nur ein Datenlogger oder Datenerfassungssystem. Es handelt sich um ein Fahrwerks-Setup- und Rundenzeit-System, das dir helfen kann, deine Fahrkünste und Leistung auf deinem Dirtbike zu verbessern. Es ist ein unverzichtbares Werkzeug für jeden Dirtbike-Fahrer, der das Beste aus seinem Fahrwerk herausholen möchte.

Motoklik Product Information Video

Du kannst verschiedene Motos und Strecken vergleichen, sehen, welche Linie schneller ist und ob deine Fahrwerkseinstellungen dich schneller machen. Du kannst deine Daten auch in das Online-Dashboard von Motoklik hochladen und mit deinem Fahrwerkstuner teilen.

Was befindet sich im Lieferumfang, was genau bekomme ich alles?

• Zentrale Motoklik-Steuereinheit. Diese Einheit wird verwendet, um die einzelnen Sensoren mit Strom zu versorgen und die gemessenen Daten der Sensoren aufzuzeichnen sowie die Daten über Bluetooth an die mobile App zu übertragen. Das Gerät enthält außerdem eine 1000-mAh-Lithiumbatterie mit 3,7 V.

• Satellitenpositionsantenne. Die Antenne wird zur Identifizierung und Fixierung von Satelliten verwendet, um die aktuelle Position in Breitengrad, Längengrad und Höhe zu berechnen und die Geschwindigkeit zu berechnen, mit der sich die Antenne bewegt. Das Gerät verfügt außerdem über eine durchsichtige Tastenkappe, die in Grün und Rot beleuchtet werden kann. Blinkendes Rot zeigt an, dass die Antenne versucht, eine Satellitenortung zu erhalten, blinkendes Grün zeigt an, dass der Satellit fixiert ist, und durchgehendes Grün zeigt an, dass Motoklik Daten aufzeichnet.

• Gabel-Messstab. Der Stab beherbergt eine Reihe von Sensoren, die die jew. Position der Gabel anhand der relativen Position eines Magneten bestimmen.

• Hinterradfederungssensor. Der hintere Sensor beherbergt eine Reihe von Sensoren, die die Position des Dämpfers anhand der relativen Position eines Magneten bestimmen.

• Vorderer Magnethalter. Der Halter enthält einen 15 mm x 5 mm großen Neodym-Scheibenmagneten und wird am Vorderradgabelschutz des Motorrads befestigt. Dieses Teil ersetzt den Klemmhalter für die vordere Bremsleitung.

• Hinterer Magnethalter. Der Halter umschließt einen 15 mm x 5 mm großen Neodym-Scheibenmagneten und wird an der Schwinge am Heck des Motorrads befestigt. Die Befestigung erfolgt durch Schrauben, mit denen die hintere Bremsleitungsführung in Position gehalten wird, und/oder durch Kabelbinder.

• Stromkabel. Die Kabelbaugruppe besteht aus drei Komponenten: dem Motoklik-Stecker, dem OBD-Stecker und der Sicherung.

• OBD-Anschluss. Dieser Stecker wird direkt an den Kabelbaum des Motorrads angeschlossen und dient dazu, eine 12-V-Stromversorgung vom Motorrad zu beziehen, die zur Stromversorgung des Motoklik verwendet wird. Die Stromversorgung vom Motorrad erfolgt über ein Relais, das nach einer bestimmten Zeit abschaltet, wenn der Motor nicht läuft, z. B. 30 Sekunden. Wenn die Stromversorgung entfernt wird, wird das Motoklik-Gerät 10 Minuten lang von der internen Batterie mit Strom versorgt und schaltet sich dann ebenfalls aus. Motoklik entlädt die Motorradbatterie nicht.

• Sicherung. Das Stromversorgungskabel enthält außerdem eine 1-A-Flachsicherung, um den Stromverbrauch unter 15 W zu halten.

Mehr Infos bekommt ihr unter www.motoklik.com
Folgt Motoklik Suspension auf INSTAGRAM
Folgt Motoklik Suspension auf FACEBOOK
Folgt Motoklik Suspension auf YOUTUBE
Motoklik Suspension Linktree: linktr.ee/motoklik
©Bildmaterial: @visual.mx.photography @j_112_kinsella and @162ey

Eine Story vom MOTOCORSS-MAGAZIN DEUTSCHLAND – Ihr habt Fragen oder möchtet uns etwas persönlich fragen? Schreibt uns eine Nachricht an info@motocross-magazin.de – Folgt uns auf unserem offiziellen WhatsApp Kanal HIER oder werdet Follower auf FACEBOOK oder INSTAGRAM

Why was suspension setup so difficult in SMX?

“The motocross section was very difficult on supercross suspension, with the braking bump getting bigger, it was tough to manage, I mean for me”. (Credit – How was your weekend, www.swapmotolive.com) Dylan Ferrandis didn’t mince his words after the first round of the Supermotocross playoff at ZMAX Dragway last September when it came to his setup. The new format threw the biggest curveball since the move to four strokes for suspension, because the tracks were actually a real hybrid.

I know what you’re thinking, these teams and riders are the best in the world, how can they not get it figured out? Why were they even using supercross suspension on motocross?

The technology in dirt bike suspension is probably often overlooked when compared with Moto GP, or Formula 1, but the truth is that the mechanism used inside a set of forks and shock to control damping is on par, or even a step above what we see used in the pinnacle of tarmac motorsports. This is because the speeds that the suspension move at are so varied compared to the smooth surface of the asphalt. Yes, when an F1 car hits the curbs, the suspension must move quickly, but this is maybe more of a blow off pressure release valve than the requirement for controlled movement like we see in the transitions of a supercross rhythm. And herein lies our answer to the woe’s of Ferrandis, as well as the other riders.

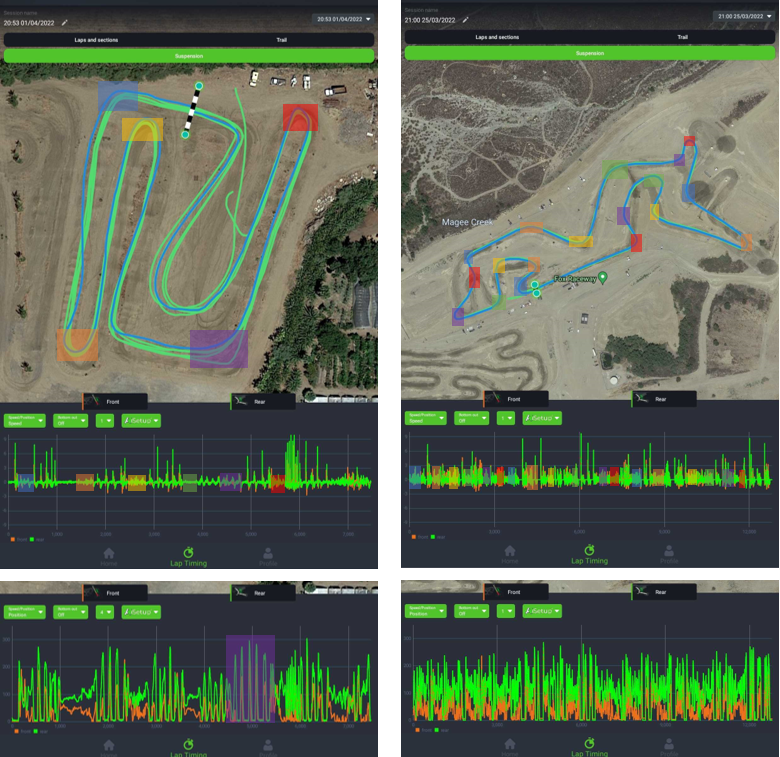
The following images show the lap outline of a Californian supercross track on the left, and Fox Raceway on the right. Underneath the track outlines is a plot of the front and rear suspension speed for one full lap, and underneath this is the suspension position for one full lap. What stands out?

You can see that the speed of the suspension in the corners in supercross is about half the speed of what you see in the corner sections of the motocross track. (The coloured rectangles on the track outline are sequenced with the coloured rectangles on the suspension speed data). This means that braking and accelerating bumps are much smaller in supercross. With smaller bumps, the riders and teams can run much stiffer suspension without losing comfort. Those are words in the world of dirt bikes that go together like peanut butter and jello; supercross suspension and stiff. Do you remember when Fabio Quarteraro tried to push down on Tomac’s Yamaha this year? Yep, supercross stuff is pretty stiff!

So, why do they need stiff suspension in supercross? The answer lies in the second graphs under the track outline, the suspension position data. At the top of the graph the suspension is fully compressed, and at the bottom it’s fully extended. You can see how even with the much stiffer settings, the suspension is still using the full stroke on a supercross track, especially the rear through the transitions in jumps (shown by the large purple rectangle). Imagine now trying to go through that section with the softer motocross settings, you wouldn’t have an ankle left!

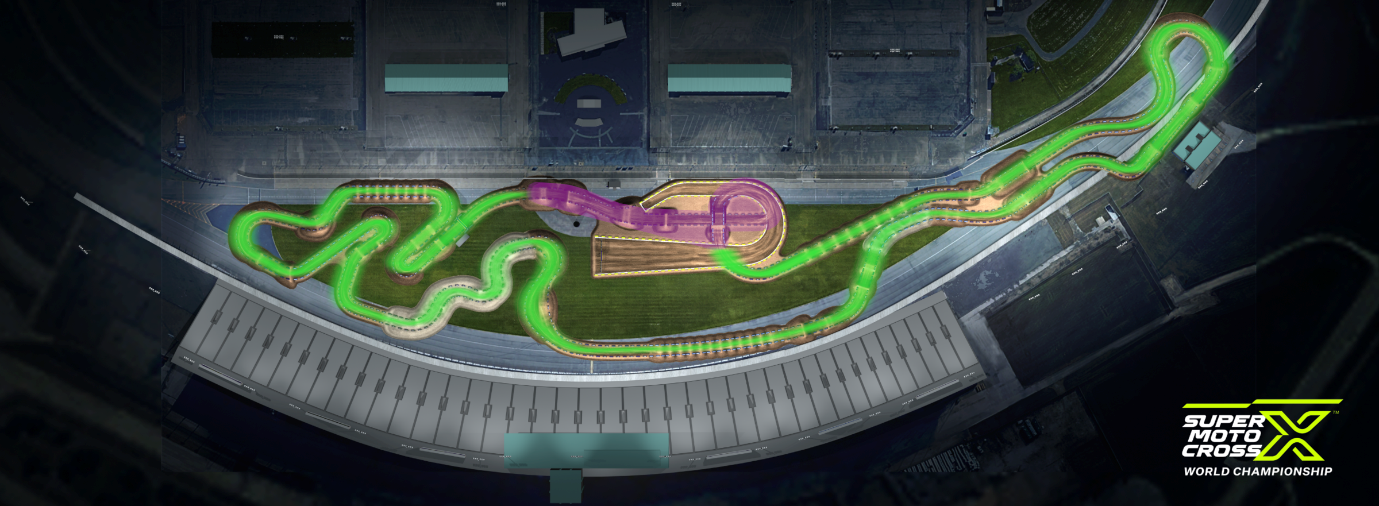
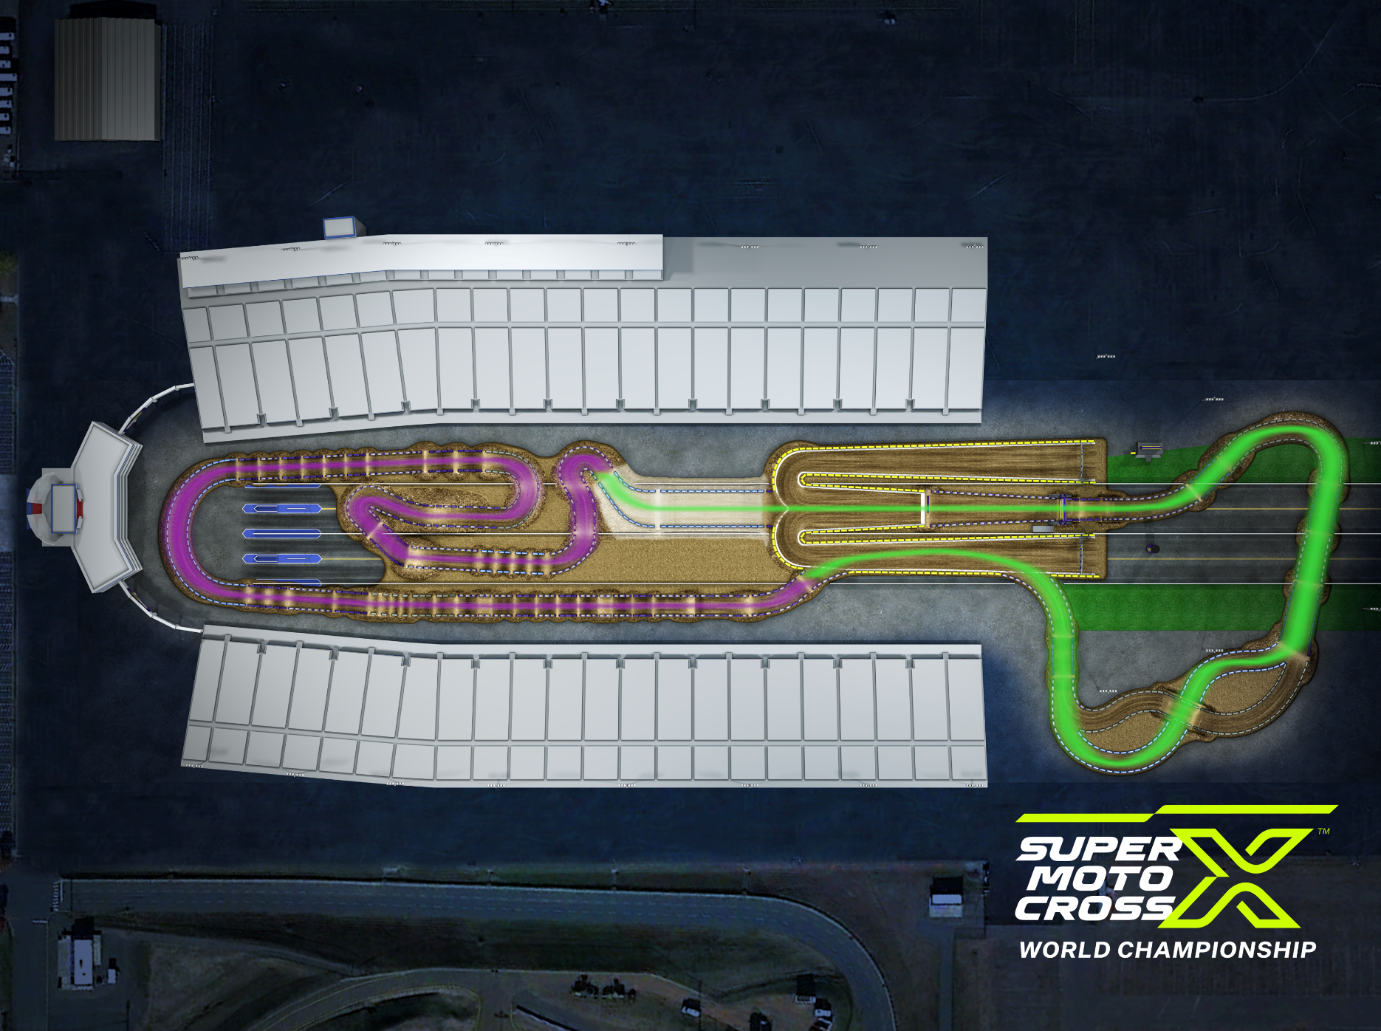
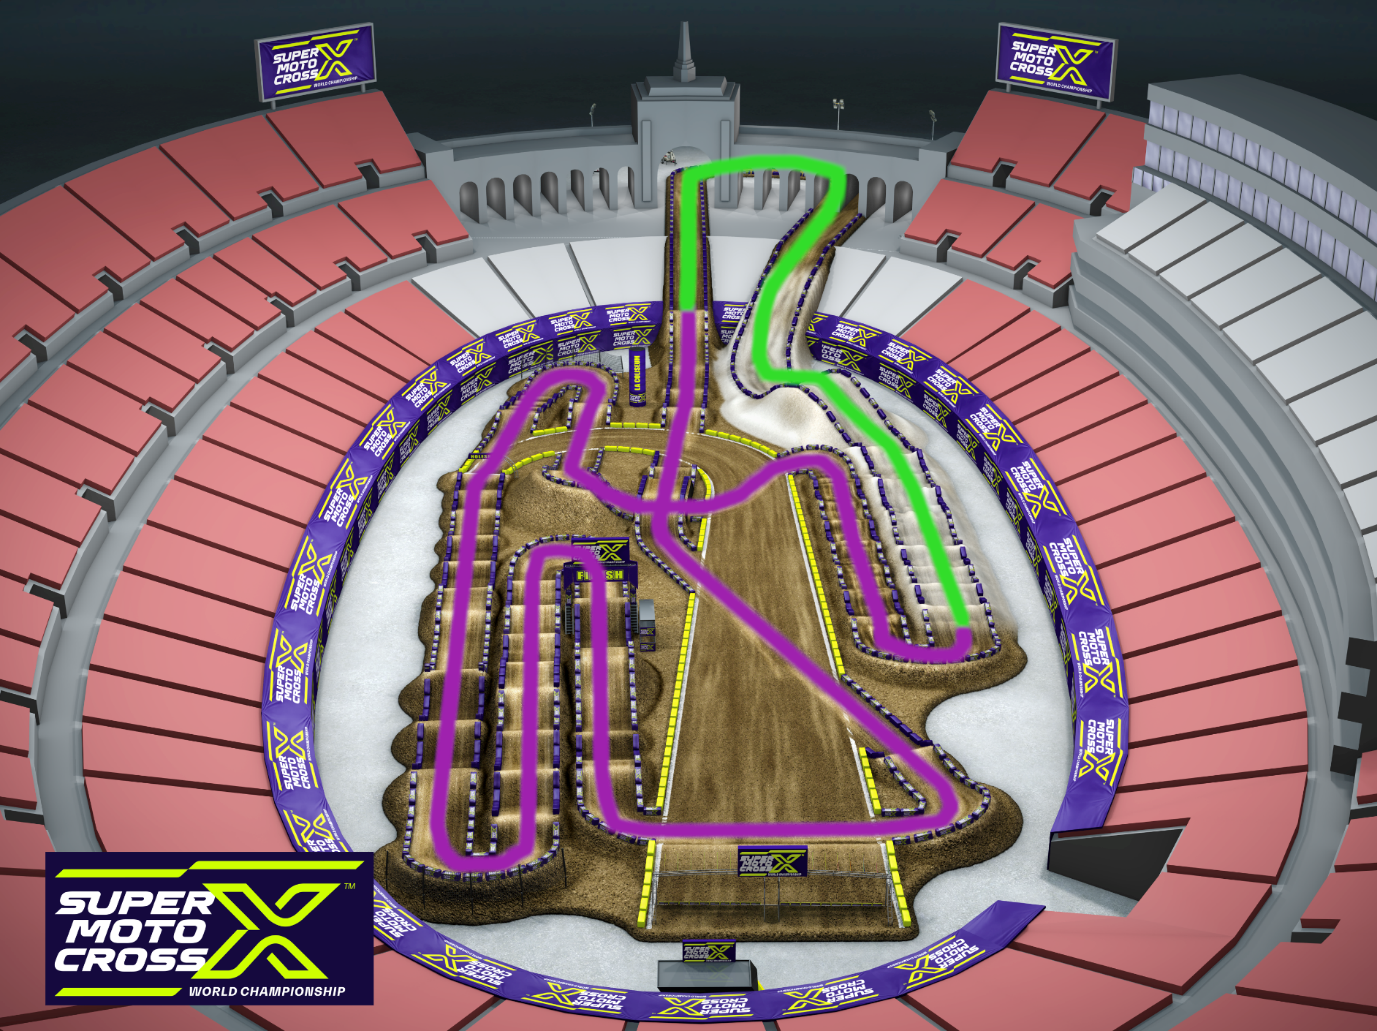
Let’s take a look at the three SMX tracks which opened in ZMAX Dragway, Concord, North Carolina, moved on to Chicagoland Speedway in Joliet, Illinois, and finished up at the Los Angeles Memorial Coliseum in California. In the following images, each track outline has been marked out with purple to show the supercross sections, and green to show the motocross sections.

The opener at ZMAX Dragway was really tough. With nearly a 50/50 split between supercross and motocross sections. At this track, there was no choice but to run supercross settings, because it would have been too dangerous for the rider to ride through the supercross transitions without the hold up of the stiffer suspension. The challenge was to ride on the faster sections outside the stadium area where the braking and accelerating bumps were building up.

Chicagoland offered some more clarity, with the majority of the circuit being a more motocross style. Even the double jumps and over-under are manageable on motocross settings, but the riders would have to be sure to be precise with their track position, especially on landing, or else they could easily end up in a situation like Tomac found himself in back in May.

Finally, there was the LA Coliseum. This was easily the most “supercrossy” of the three venues, albeit a little bit toned down with the absence of whoops. Nevertheless, the riders were still challenged, especially in the sand section where we saw big crashes from Aaron Plessinger, Dean Wilson and most notably Chase Sexton. How much of the blame for these accidents can be laid at the feet of setup though is up for debate, as the malleable surface of sand can often throw a curveball.

What can be done in future to help the riders and teams navigate setup in these venues. If we take the example of Formula 1 again, each time they go to a new track, they are going in blind right? Well not really. Every time these teams go to a track, they gather as much data as they can, including suspension position and speed. Before ever rolling a lap around a new circuit, they can already model up how they think the car will perform in those conditions, and once they gather some on track data, they can fine tune the settings. Maybe the track is a little bumpier, or the corner speeds are slightly different to what they modelled. Well, the same can be done for motocross, supercross and supermotocross.

The current method of suspension testing and development on dirt bikes is heavily based on trial and error, and rider feedback. Rider feedback is always necessary as it is the requirement of the suspension to keep the rider as comfortable as possible, not to satisfy a math’s equation. The down side is that over 90% of riders can find it difficult to communicate what the bike is doing on the circuit. If teams had gathered suspension data from the supermotocross tracks this year, it may have been possible to identify areas for improvement in the design of the damping curve, or more position sensitive damping, as well as be able to better judge the settings needed for tracks in the future. It looks like SMX is here to stay, and so too will be the handling issues felt by Dylan Ferrandis and other’s this year.

If you would like to work with us, or the Motoklik system, please feel free to email me on jens@motoklik.com

Kind Regards,

Jens
How to decide which shim to adjust in a shim stack.

Shims, shims they’re good for your bike, the more you change them, the more the handling goes to…..

Introducing shims to dampen oil flow was an absolute triumph in suspension technology. There’s no doubt that the switch from squishy and harsh orifice damping to using these round little slices of glory improved performance massively, and brought in a whole new world of tuning options. Sounds like great news right?

Of course it is, but the new challenge of figuring out how to adjust the shim diameters, thickness’s and arrangements created the dark art of suspension tuning that we know of today.

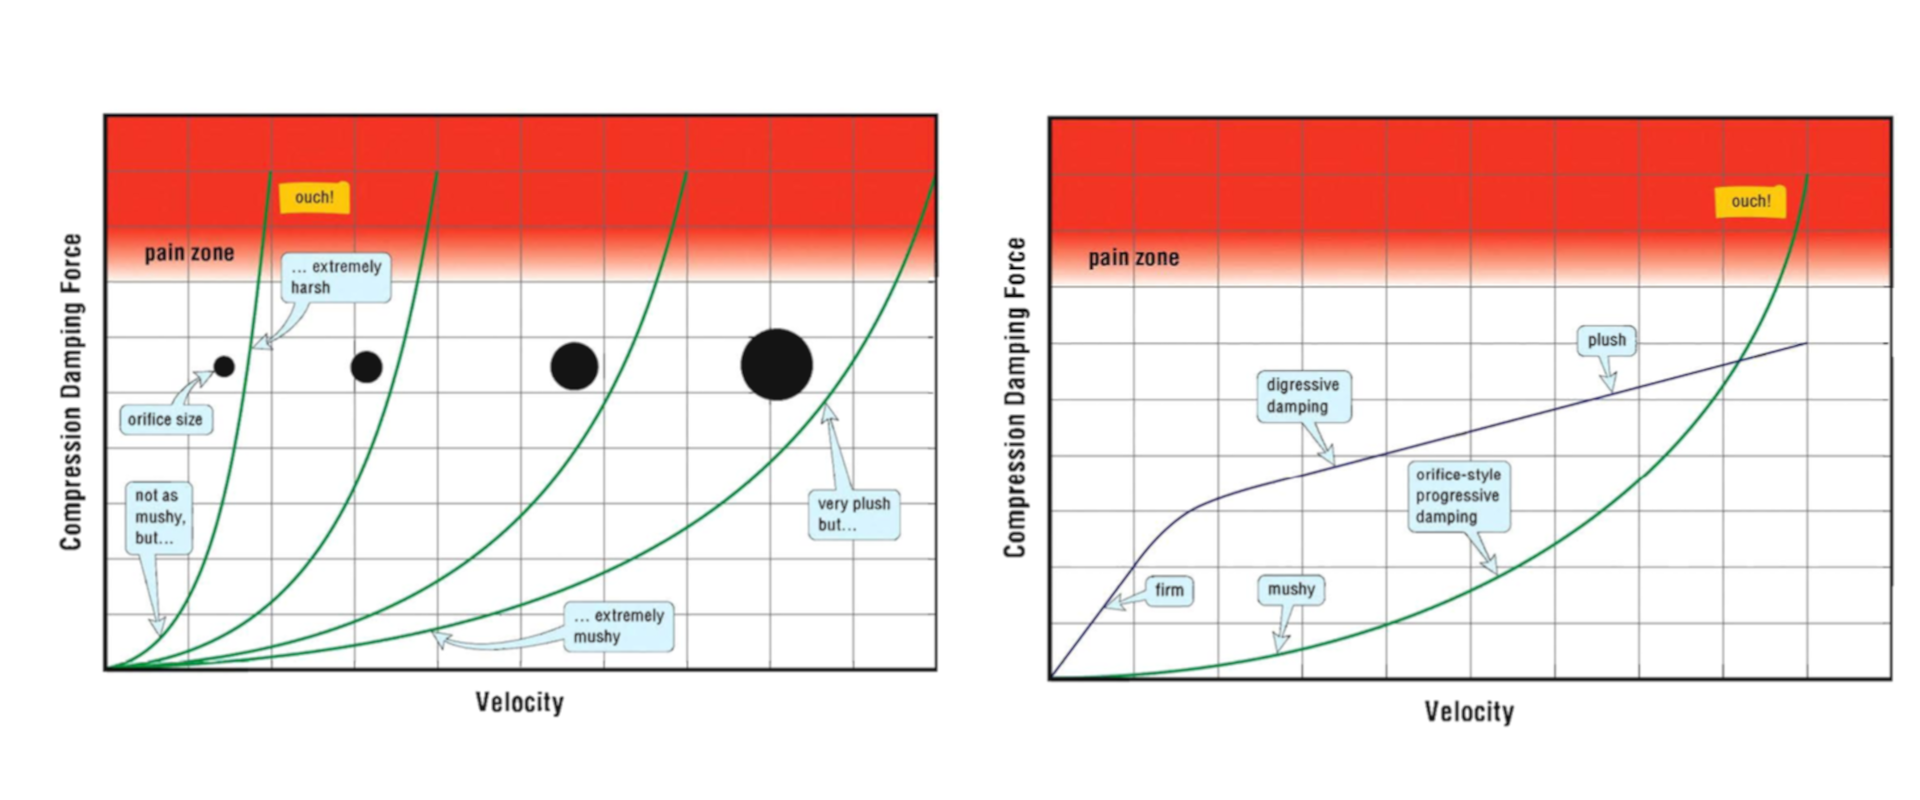
As a quick recap, shims will bend out of the way of the oil flow, making a more linear or digressive damping curve. This gives the suspension good hold up over low speed impacts, but allows the suspension to move on high speed impacts. Compared with orifice damping which was just a hole drilled in a tube, so it offered little to no resistance under low speed, and increased damping exponentially at high speed, causing it to feel harsh.

The graph below is from the Racetech Suspension Bible  and shows how increasing the orifice diameter affects the damping curve on the left, and how using a shimstack compares with an orifice on the right.

I have to preface this article with the fact that I have never worked as a suspension technician. However, I do have a masters in engineering, but my time working as a car mechanic with my older brother taught me that the piece of paper they give you at the end of college isn’t much use when you’re wrestling a diesel four wheel drive gearbox onto a spigot shaft.

What I will try to do here then is marry together the literary research I have carried out over the years, with the practical knowledge I have garnered from hanging around suspension technicians.

The question we will try to answer today is, which part of the shim stack should I target to make a rider feel more comfortable?

There are probably technicians who could answer this question just from raw experience, and trial and error. By using an analytical approach though, we can reduce testing time, and document a lot of that information gathered through experience. Every technician has to retire some time, and it’s an awful pity to lose all that knowledge.

Let’s start with what we know already.

From our previous articles, we know the average speed of the suspension movement on different sections of the track, and that we can use dyno’s to measure the suspension damping force effectively for the speed’s we see on the circuit.

What we don’t know, is which part of the shim stack is affected by how much force. If we know the answer here, it becomes straightforward to know which part of the stack to adjust. So how can we calculate the stiffness of each part of a shim stack?

Fortunately, there are lots of very clever people in the world, and one website I came across www.shimrestackor.com, has developed a piece of software that you can input all the shim dimensions from your stack, and it will print out a stiffness graph. You do have to pay a license fee for the software, and for the purpose of this article, I cam across a formula on the site that I could use as a rough substitute to demonstrate my point. The following formula basically calculates the stiffness of each shim, and by adding all the stiffnesses together, you can see how stiff the stack is at each point.

Woah!! What the heck is that?

Don’t get too put off now, let’s just look at this in plain English.

There are a few different symbols in there that mean the following:

K Stack: How stiff the whole shim stack is.

n: The number of shims in the shim stack.

Ki: The stiffness of the i-th shim.

Ei: How stiff a material is.

ti: The thickness of the i-th shim.

vi: How much the shim will squish out when it’s squeezed together.

Ri: What the radius is for the curve of the shim when it’s being pushed out of the way by the oil.

So what we do is calculate out K for each shim, and then add each K value together.

There are many assumptions built in here, and this equation also doesn’t account for crossover shims, or other variations, but as I said, this is a rough estimate.

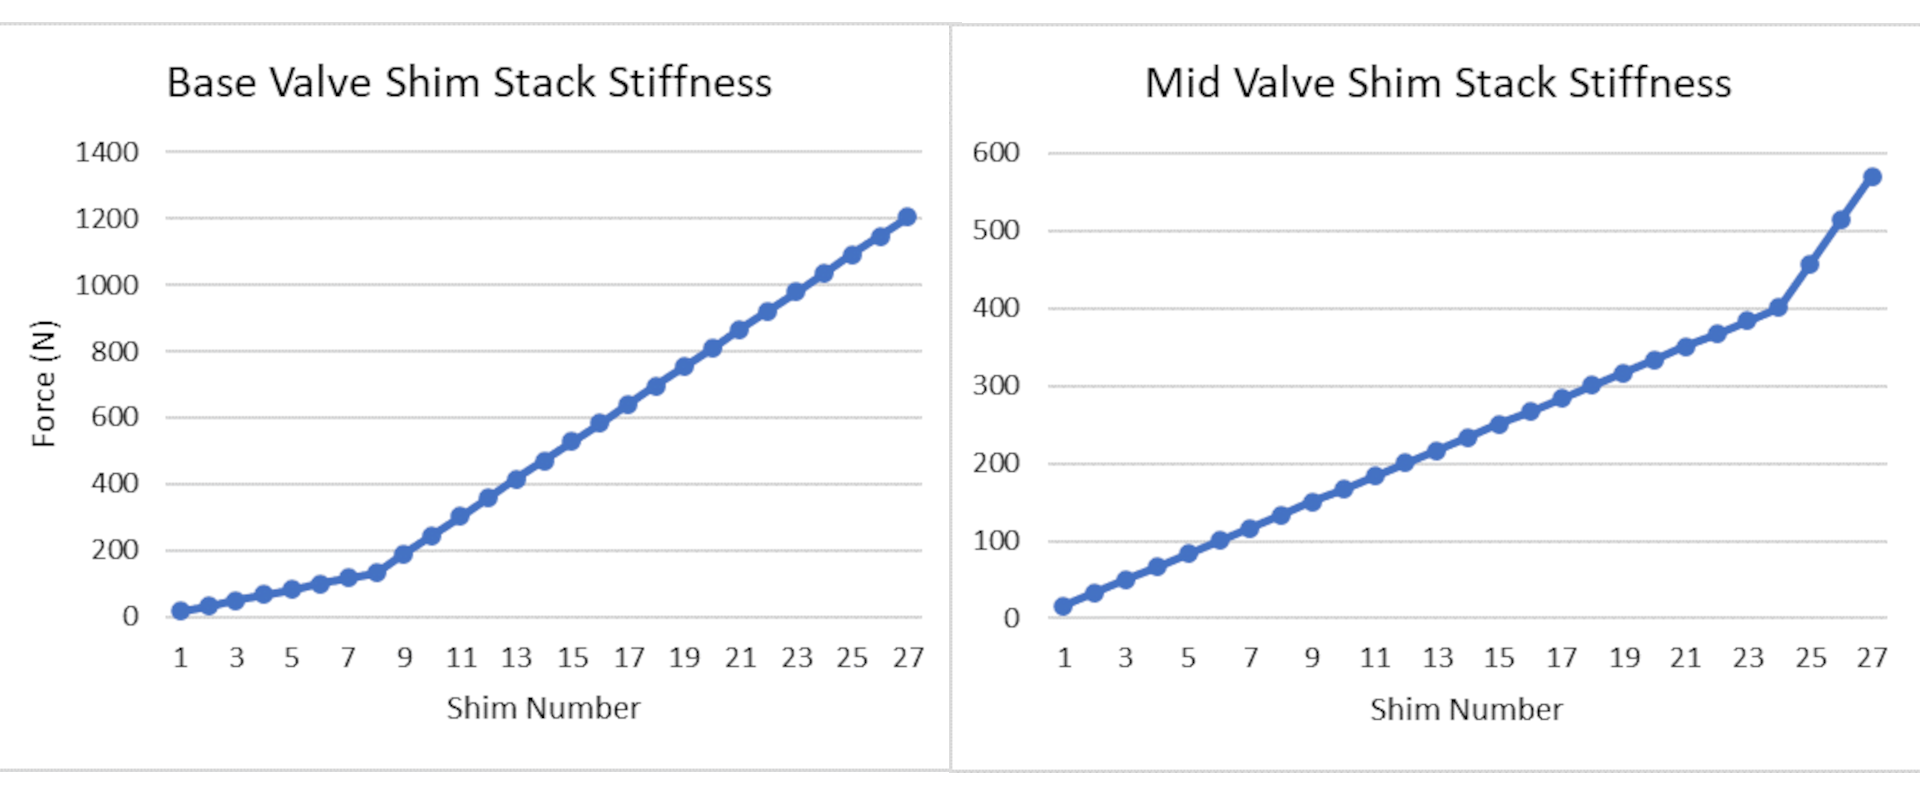
The shim values I am using are the standard settings from a WP XACT fork for the base valve and the mid valve. I just plug in the values from this sheet into the formula above, and it results in the following two graphs:

These graphs show the force created by each shim in the base valve and the mid valve using the formula. There were 27 compression shims in each stack, excluding the clamp shim. What’s strange to me is how the mid-valve maxes out at 600N, while the base valve goes up to 1200N.

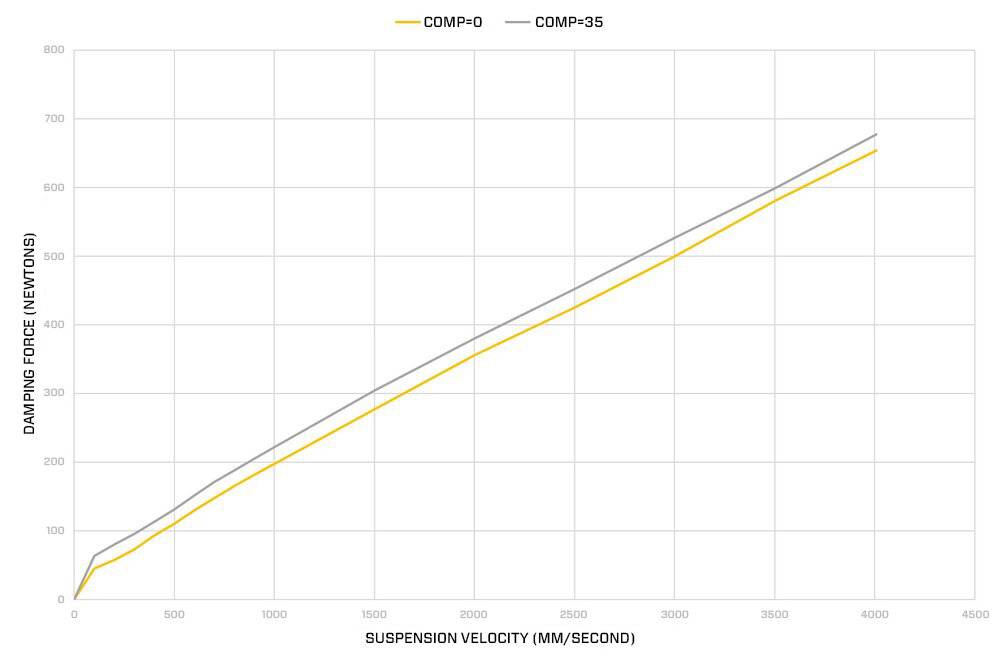
And if you remember from our last article on dyno’s the above graph is from Kreft suspension, and shows the damping force in Newton’s created at speeds from 0m/s up to 4m/s. Our last piece of the puzzle is to know how fast the suspension is moving on the part of the track the rider doesn’t feel comfortable on. There are two ways we can do this, one is to take the average speed of the suspension in compression on that part of the track, or two is to view the actual speed in the Motoklik app.

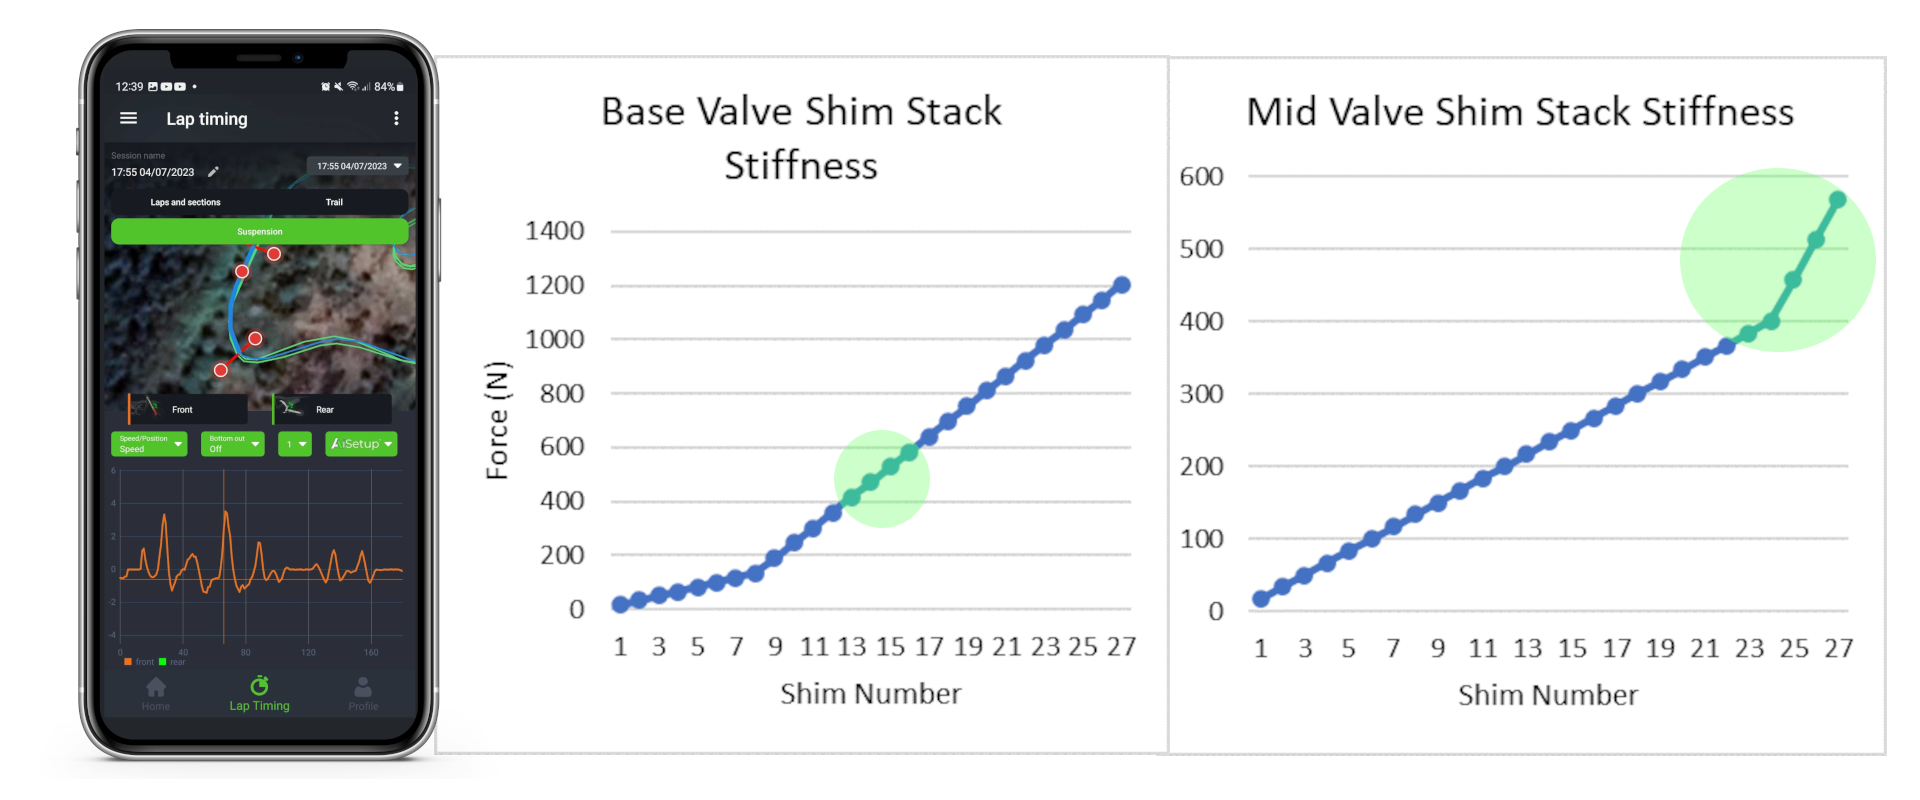
As an example, if the rider is having an issue on corner entry, the data from the speed of motocross suspension article showed that the average speed on corner entry was 0.506m/s. Working this back through the Kreft graph shows that the average force is around 120N, and working this back again into the shim stack graphs shows that this is around shim 6 on the base valve, and shim 8 on the mid valve.

Looking at example two, using the Motoklik app, I have picked a corner entry on the track. If the rider was complaining saying that they feel a harsh hit, we can easily see this in the speed the suspension moves on the graph. Taking this a step further, and assume we don’t want to affect the other parts of the turn, we can isolate the hard hits to between 2m/s and 3.6m/s. Converting this into a force shows that we are between shims 13 and 17 on the base valve, and 22 to 27 on the mid valve.

This whole article is just looking at one particular circumstance, and all of the values and forces can change depending on the type of rider, type of track, and configuration of the shim stack.

I do think it’s clear to see that by taking an analytical approach, we can be much more targeted in the changes we make to shims, and by gathering data continuously, we can build a detailed picture of suspension performance.

If you want to work with the Motoklik system, you can email jens@motoklik.com with any questions you have.

Kind Regards,

Jens
P.S.

Thankfully Craig Dixon was on hand to point something out which I missed in the article, please read below to see what else to be aware of:

“This is both correct and incorrect, identifying the shim area is fine but shims do not act as individuals, nor is there an identifiable high speed or low speed area of a shim stack. changing any shim changes the forces across the entire velocity / damping range. For example if we are to make a change to a high velocity shim (#13 to pick a number) and make this part of the damping stiffer, the low speed area will also increase in damping in proportion to the change made, if only a high speed adjustment is needed then we must also change the low speed shim stack (softer) to keep this section at the original damping force.”

Are they worth it? Shock dynos in motocross.

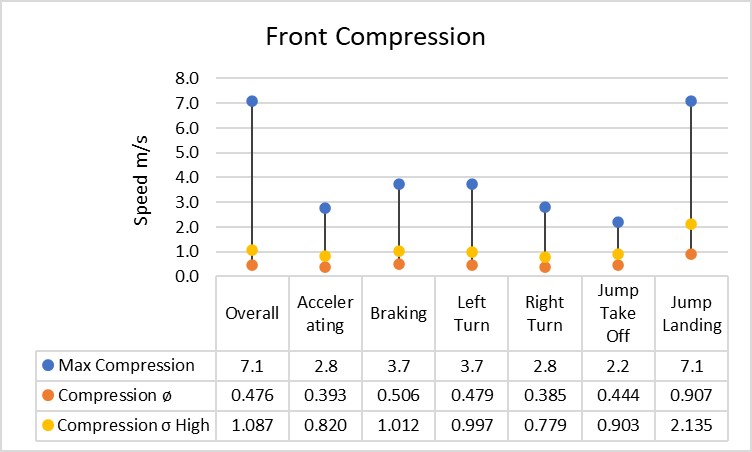
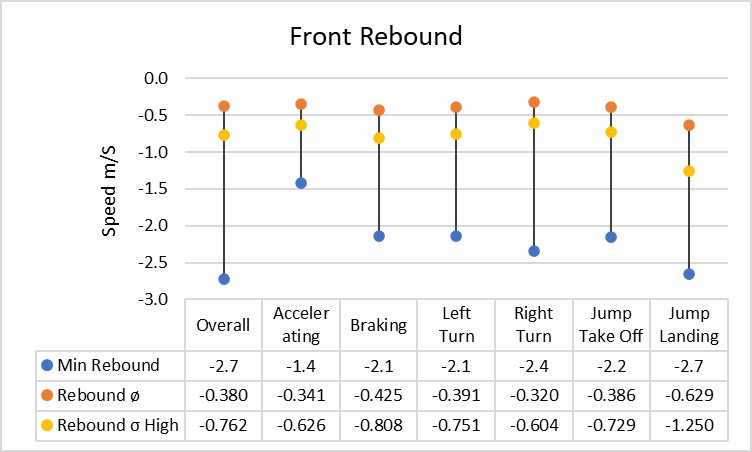
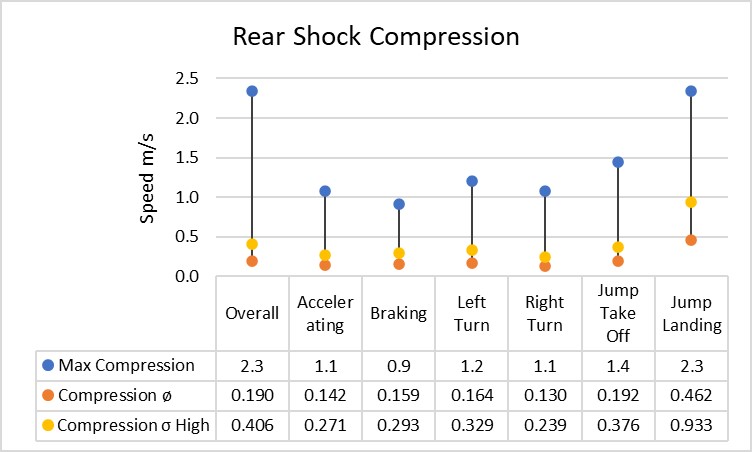
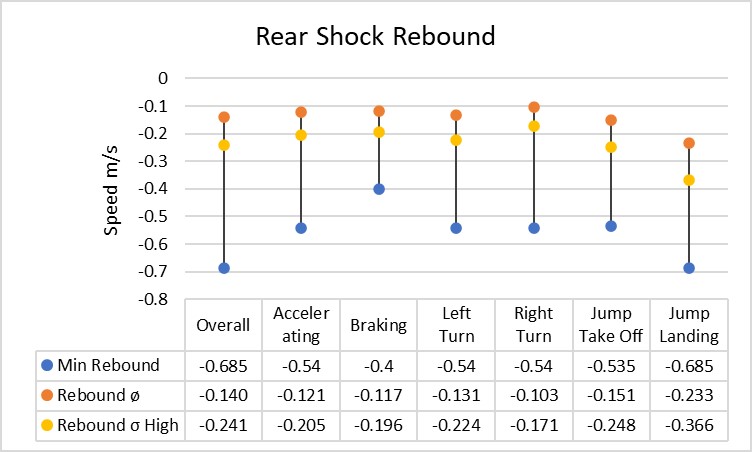
In our last newsletter, I wrote about the average speeds of motocross suspension on a hardpack circuit. There were some surprising values in there, including max speeds of up to 7.1m/s on the forks, and 2.3m/s on the shock. This brings up the question then, is it worth it to use a shock dyno in motocross?

The reason being that most shock dynos on the market have a maximum speed of 2.5m/s to 3m/s, and many times suspension technicians will run their tests at 1m/s. That’s surely a problem, isn’t it? How can a technician be sure that what they change on the shim stack is having the desired effect on the track?

There are two things we need to find out:

Can a dyno be run at their maximum speed of 3m/s with motocross suspension?

And, how much time does the suspension spend above 3m/s on the track?

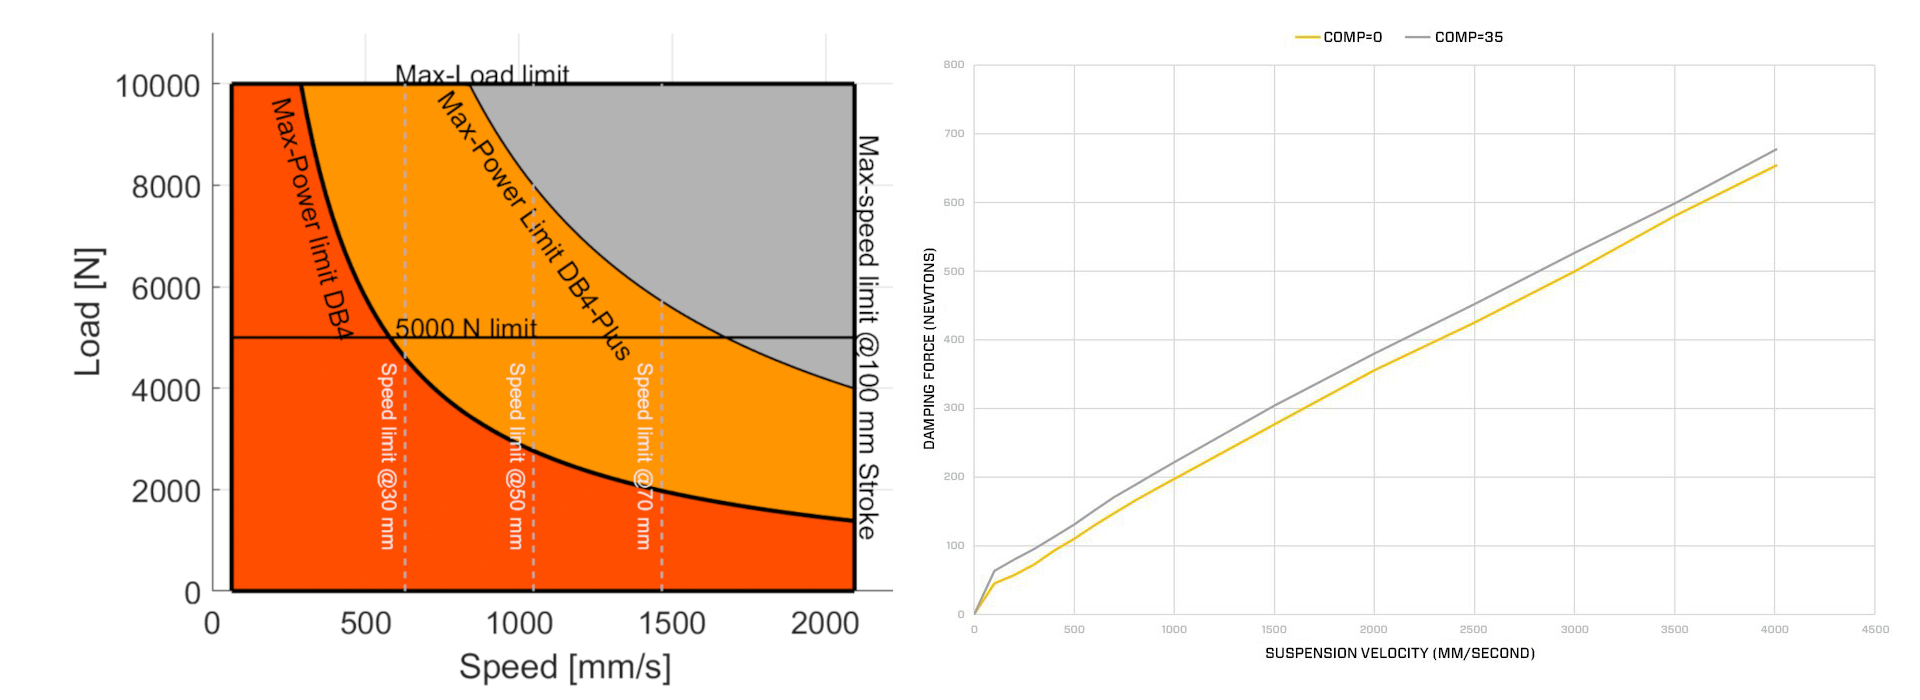
In the image above on the left are the specifications of the Andreani DB4 and DB4-Plus dynamometer’s, and on the right is a force vs speed graph for standard WP XACT fork suspension from the Kreft suspension website.

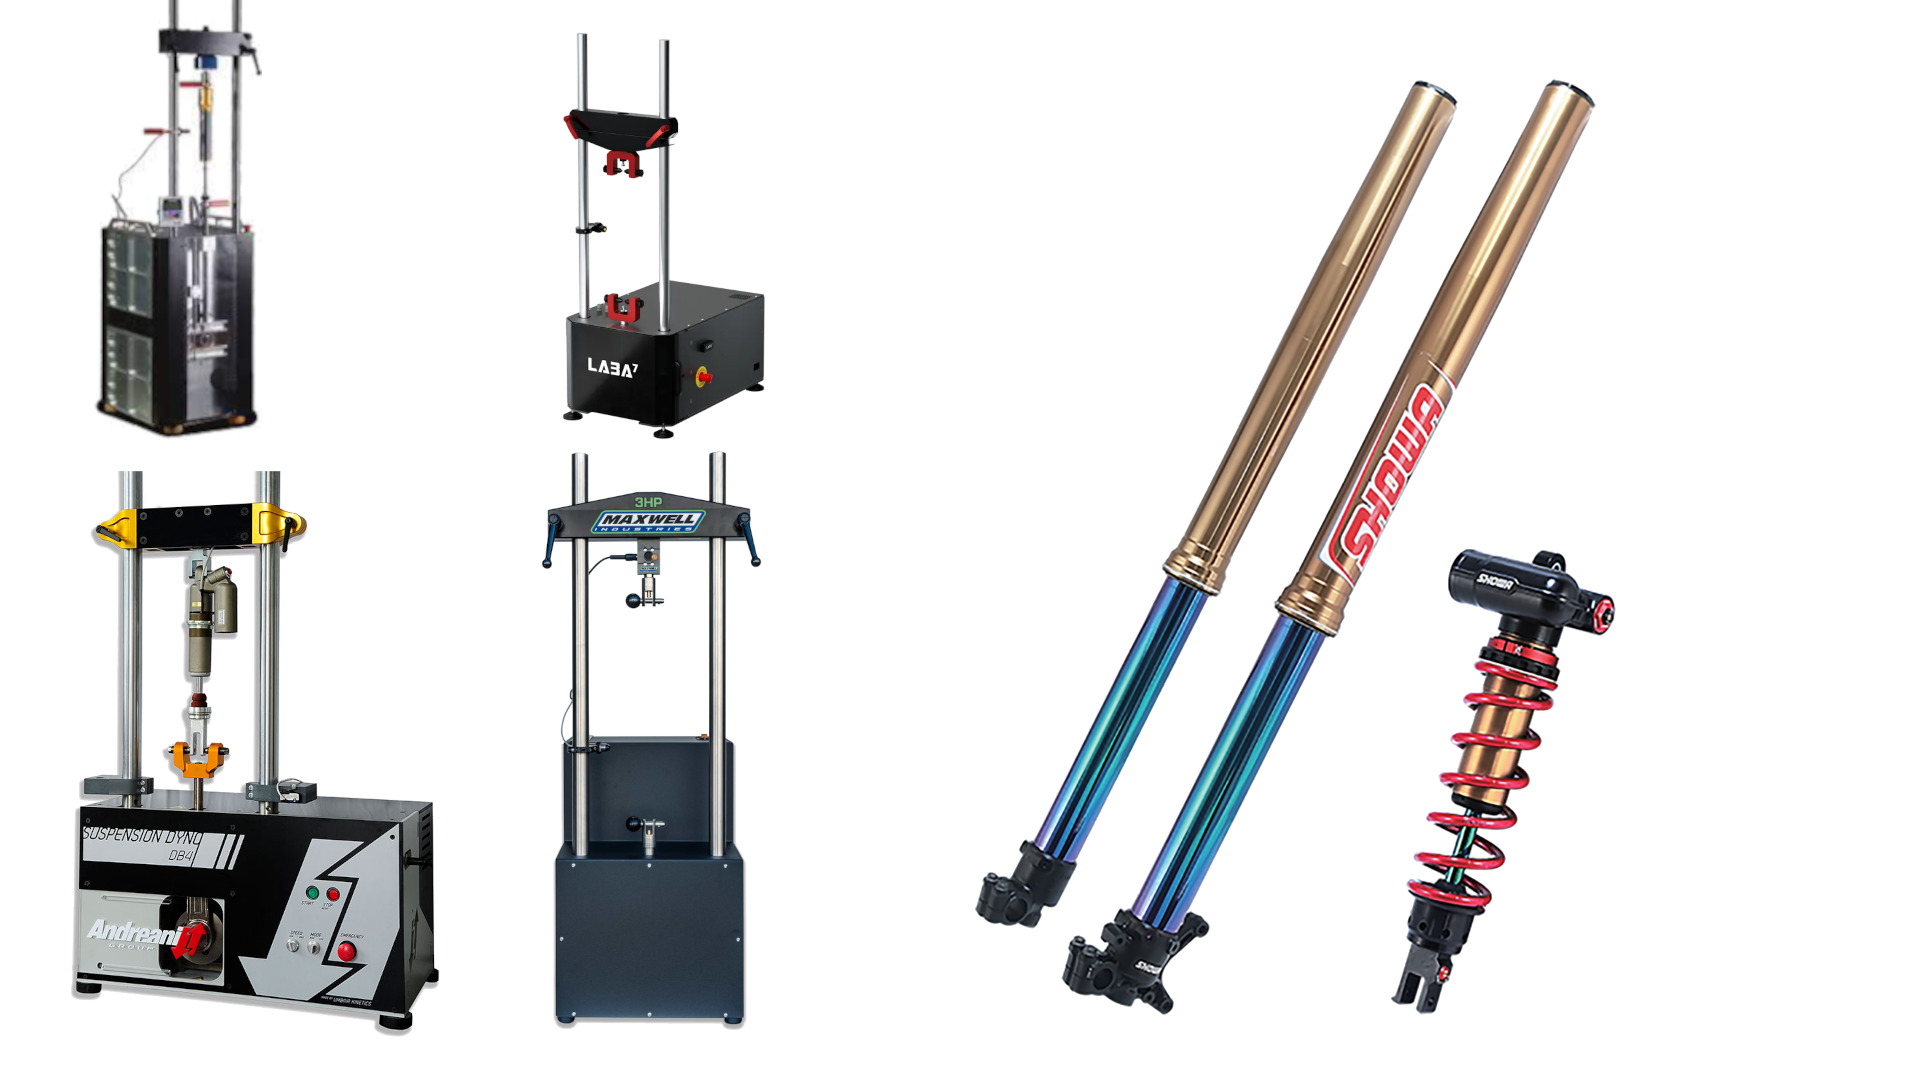
For the most part, the type of dynos you will find with a motocross suspension technician are Scotch-Yoke or Crank dyno’s, and you can read about the Pro’s and Con’s of each on Laba 7’s website.

What’s being shown in the Andreani graph is that with the DB4 dyno, the suspension can only produce a force of 2,000 Newtons at 2m/s.

On the Kreft moto graph, it shows the measured force of the fork vs the speed. The speed goes up to a max of 4m/s, and the force at that point is slightly less than 700N.

That all seems fine then, the fork can be ran at maximum speed on this dyno.

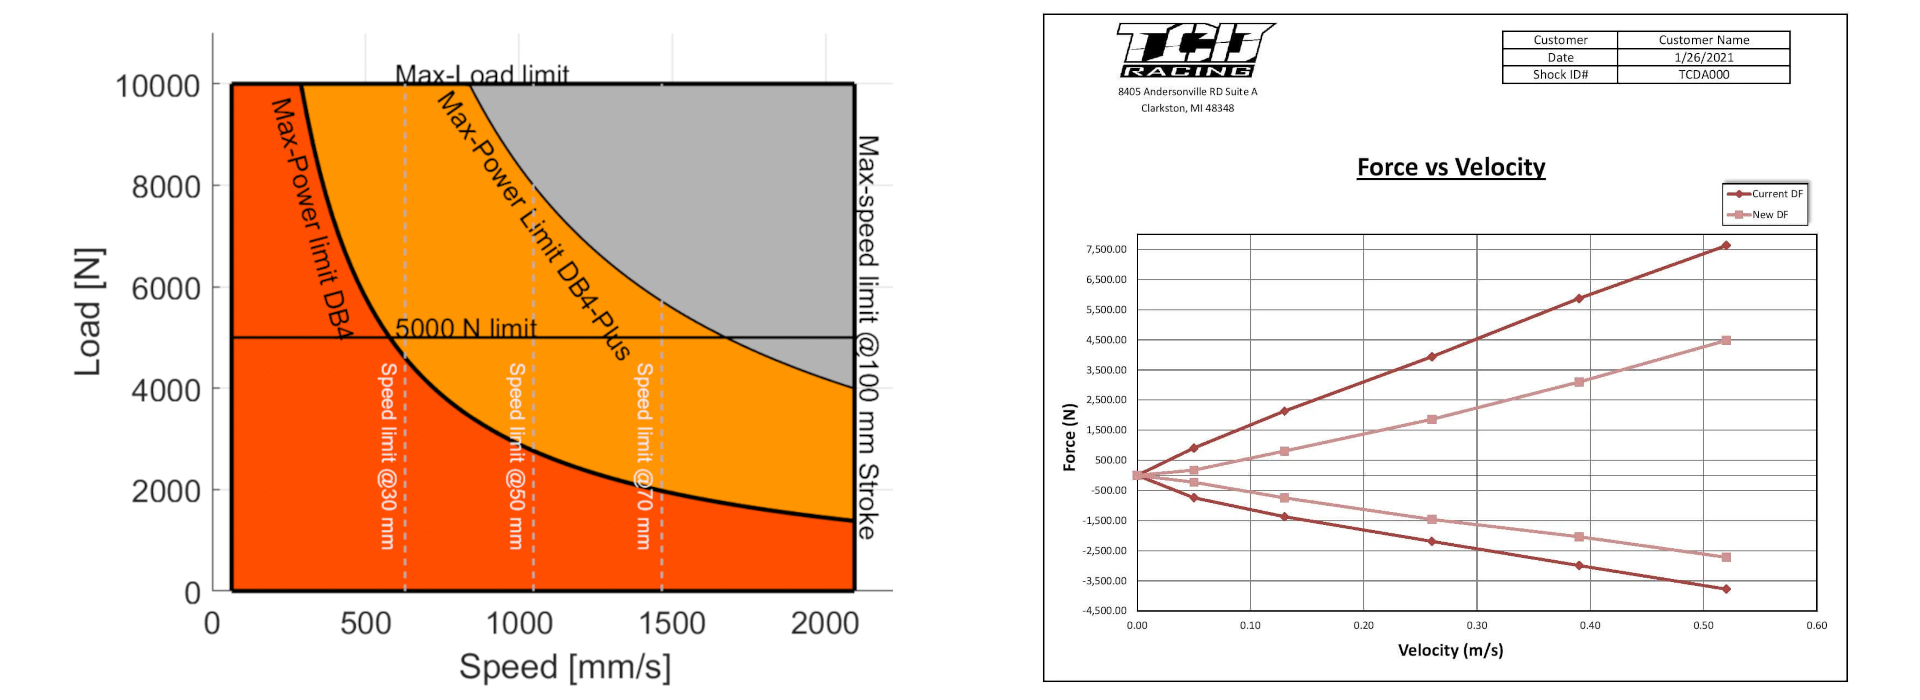
In the image above on the left are the specifications again of the Andreani DB4 and DB4-Plus dynamometer’s, and on the right is a force vs speed graph for a Showa shock on the TCD Racing website.

On the TCD Racing graph, it shows the measured force of the shock vs the speed for both compression and rebound. The upward trending lines are the compression values which are the focal point of this article. The max force measured is 7,500N with the standard shim settings, and only at a speed of 0.52m/s. With the shim stack adjustments made by TCD, this value is dropped to 4,500N

Even with the softer TCD settings, this means that by the time the DB4-Plus dyno gets to 0.7m/s or 0.8m/s, it could already be at its limit. Now, I’m not pointing a finger at the DB4-Plus, it could very well be the same issue with most dynos that are used, it is just that Andreani were open enough to provide this information on their website, and it’s all I have to work off.

What about the answer to our first questions, can dyno’s be ran at their maximum speed with motocross suspension?

For the forks, we can likely say yes. For the shock, it’s a maybe leaning towards a probably not. It really depends on the stiffness of the shim stack and valving setup in the shock.

But does that really matter if we compare it to real world data? Let’s have a go at answering our second question.

Throughout these articles, I have been using the same data set for each example. The data comes from a German hard pack track, with a young rider on a 2023 Husqvarna TC 250.

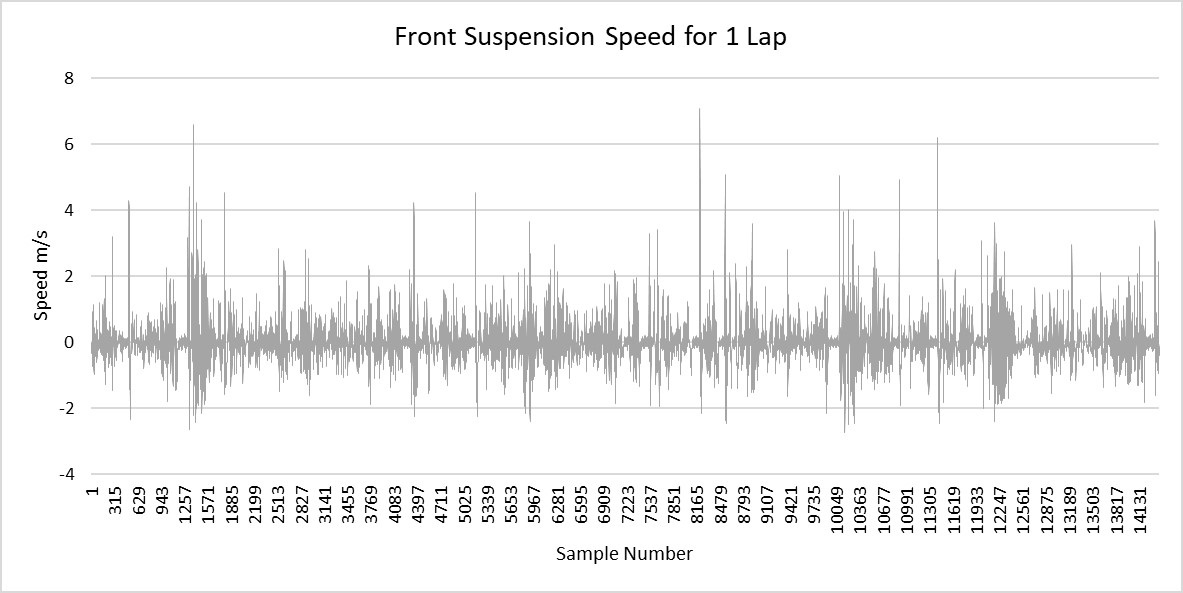
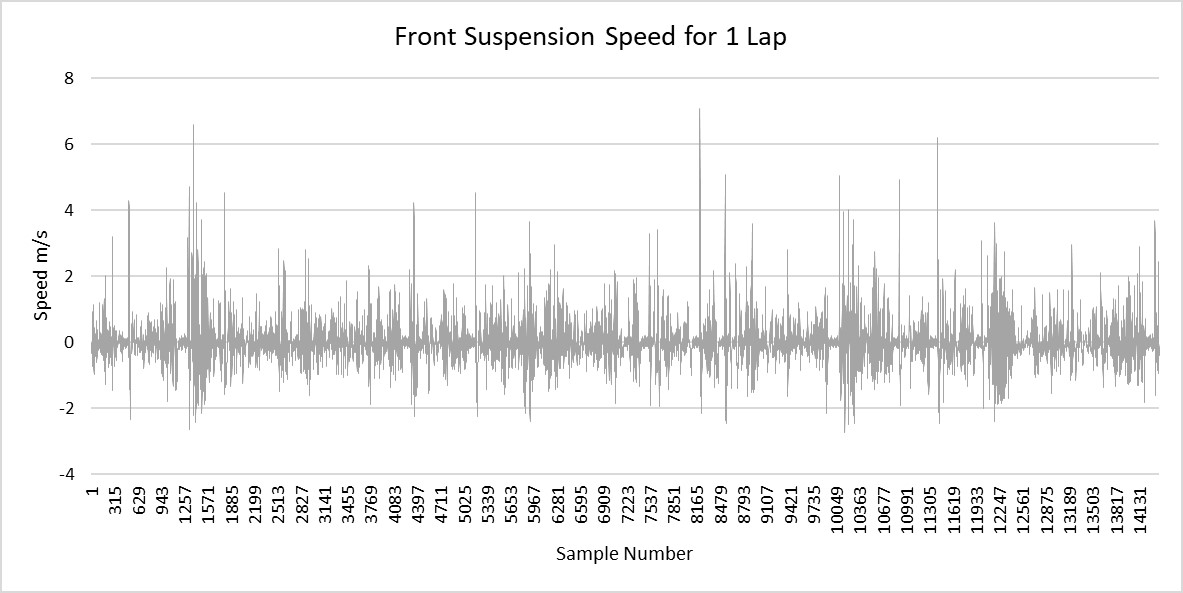
You will have seen the graph above before in our previous article on improving the accuracy of our predictions for suspension setup. It shows the speed of the forks throughout the entire session, which was around 3 laps long. We found out in our last article on average suspension speed that the suspension moves fastest on jump take off’s and particularly landings.

We can see a number of times where the suspension reaches speeds far higher than the max speed for most dyno’s of 3m/s, but how often does it move that fast really?

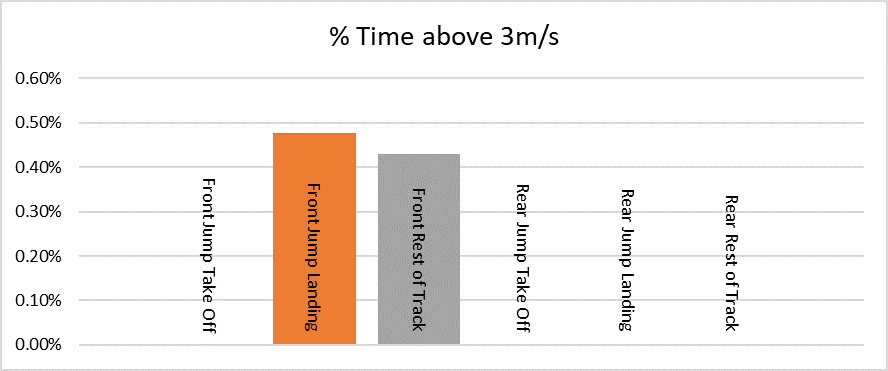
I have broken the data out for the front and rear and calculated what percent of time is spent above 3m/s for the forks and shock.

The total time the forks spend above 3m/s is 0.91%.

The total time the shock spends above 3m/s is 0.00%.

Yippee! This means that measuring the suspension at the max speed on the shock dyno doesn’t bring us an awful lot of value, and probably isn’t worth worrying about. Remember, on the rear shock, we extrapolated that the max speed would probably be around 0.8m/s.

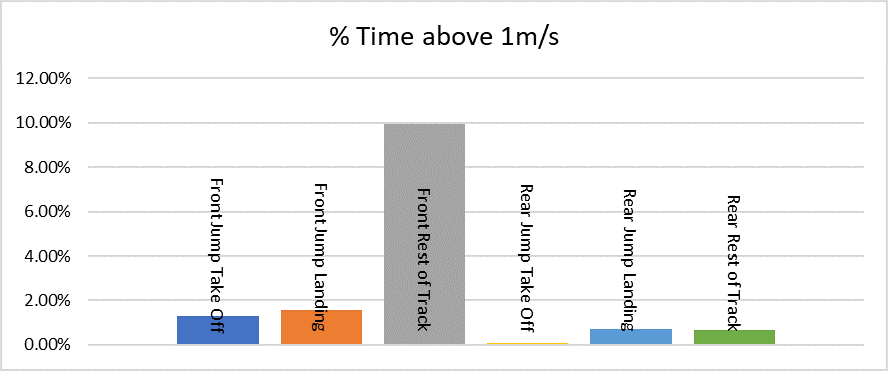
However, from speaking with suspension technicians, I know that many of them run their dyno’s at 1m/s. So let’s carry out the same analysis again, and find out how much percent time the suspension spends above 1m/s.

The total time the forks spend above 1m/s is 12.76%.

The total time the shock spends above 1m/s is 1.45%.

13% is a pretty significant amount of time to ignore, but we also know now that the dyno should be able to run forks at max speed because the damping force is low enough.

What does all this mean then.

The bottom line is, the higher end dyno’s that are available on the market should be satisfactory to cover 99% of the time the suspension spends moving in the real world, but you have to be careful about the maximum force for the rear shock. If you’re a technician that is working with supercross suspension, there could be some real challenges if the dyno isn’t up to the specification you need.

Something else to watch out for here, is that this is only one example with some pretty big assumptions about the damping forces created by the suspension, and data from just one session on one track. There can be a lot of variables that skew the outcome of this study one way or the other.

There is no doubt that dyno’s are an excellent tool for performing quality assurance checks, as well as optimising the damping characteristic for different type’s of riders. Even if you want to see what the force curve is at the max fork speeds of 7m/s that we saw in the first graph, by running the dyno at max speed of 3m/s, you could probably have a good guesstimate at what the damping curve looks like.

If you want to work with the Motoklik system, you can email jens@motoklik.com with any questions you have.

Kind Regards,

Jens
Select your currency