When we turn a clicker in, we stiffen the damping, and when we turn a clicker out, we soften the damping. This has an equal effect throughout all stroke speeds, right?
Yes, in an ideal world, there is usually a constant increase or decrease in force needed to move the suspension across the speed range that the suspension moves at.
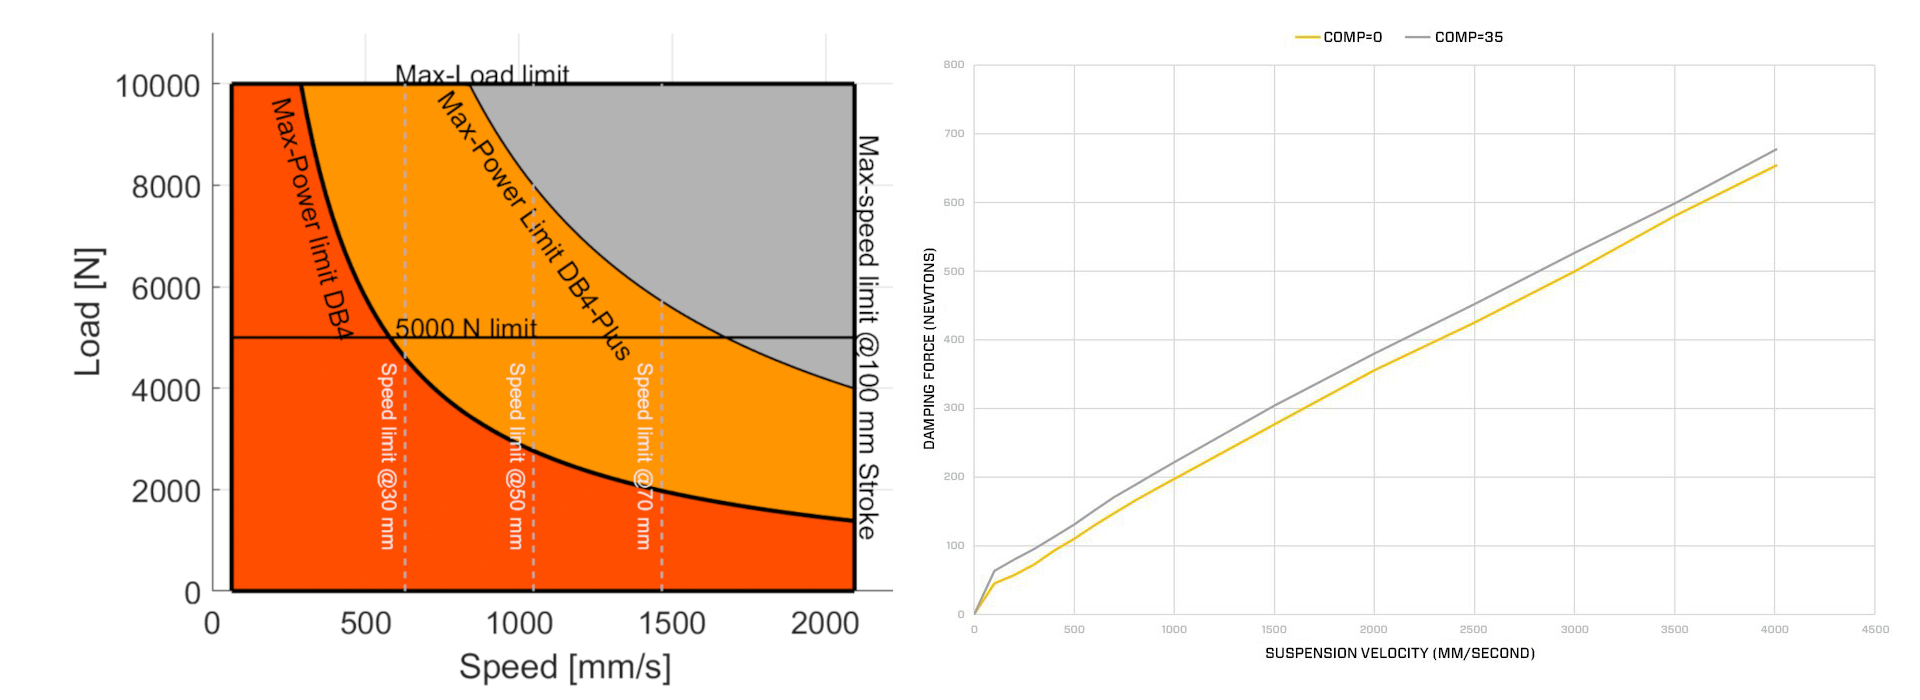
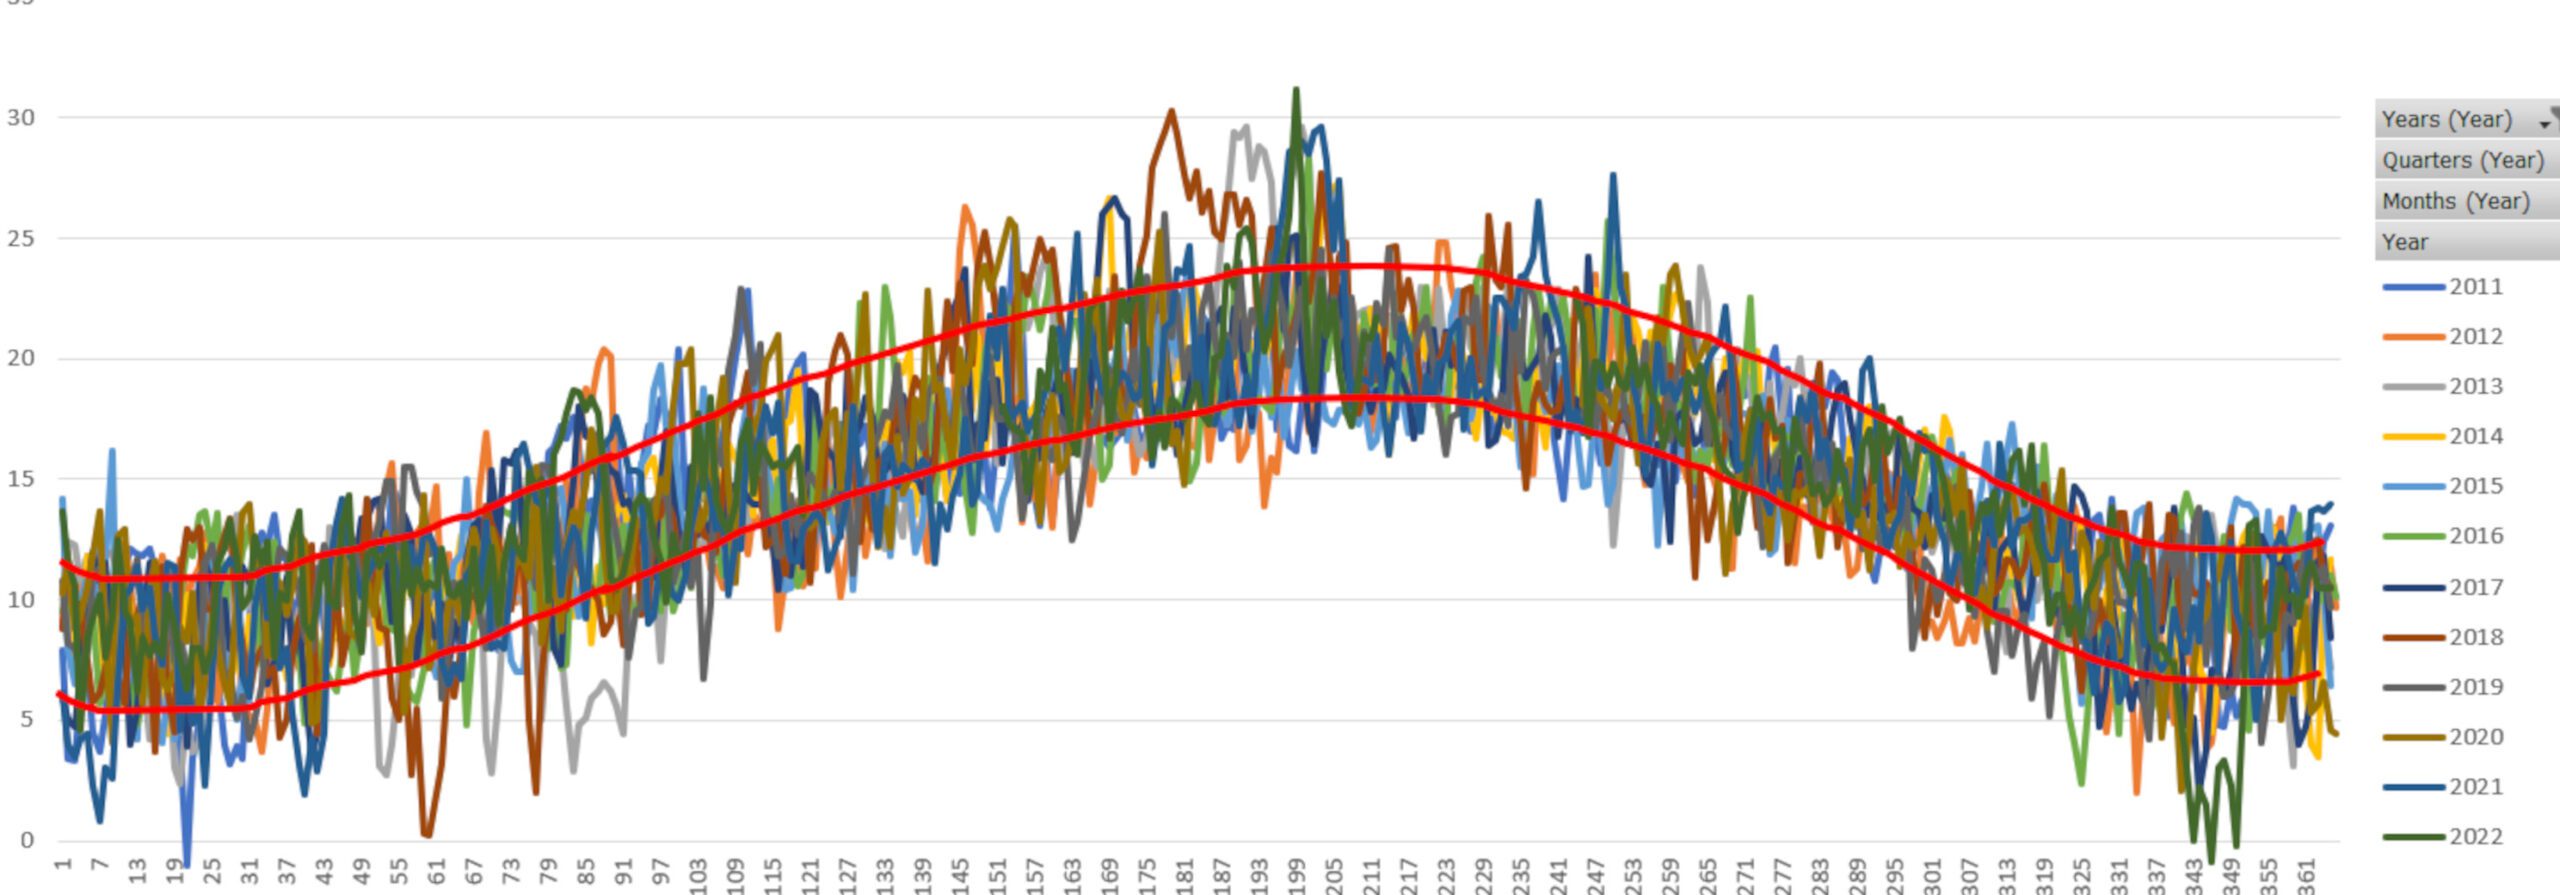
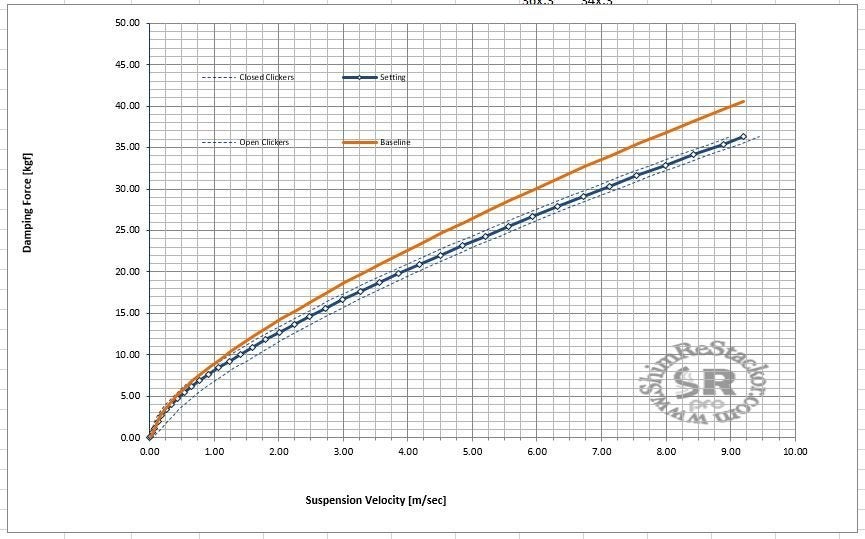
Take a look at the example below. The blue dotted lines either side of the solid blue line show the force measured across varying speeds with the clickers closed (top dotted line) and clickers open (bottom dotted line). We can see from the graph that the change in the damping force across the speeds is pretty much the same, around 0.5kgf (except for at very low speeds where the force starts from 0).
(The image below is from a Thumper Talk post, but the graph appears to be from Shim Restackor.)
I believe most average riders think that by turning the clickers, they will be able to solve any of the issues they are having on the track, regardless of how fast the suspension is moving, because the clickers have the same impact all the way through the different speeds.
This isn’t true.
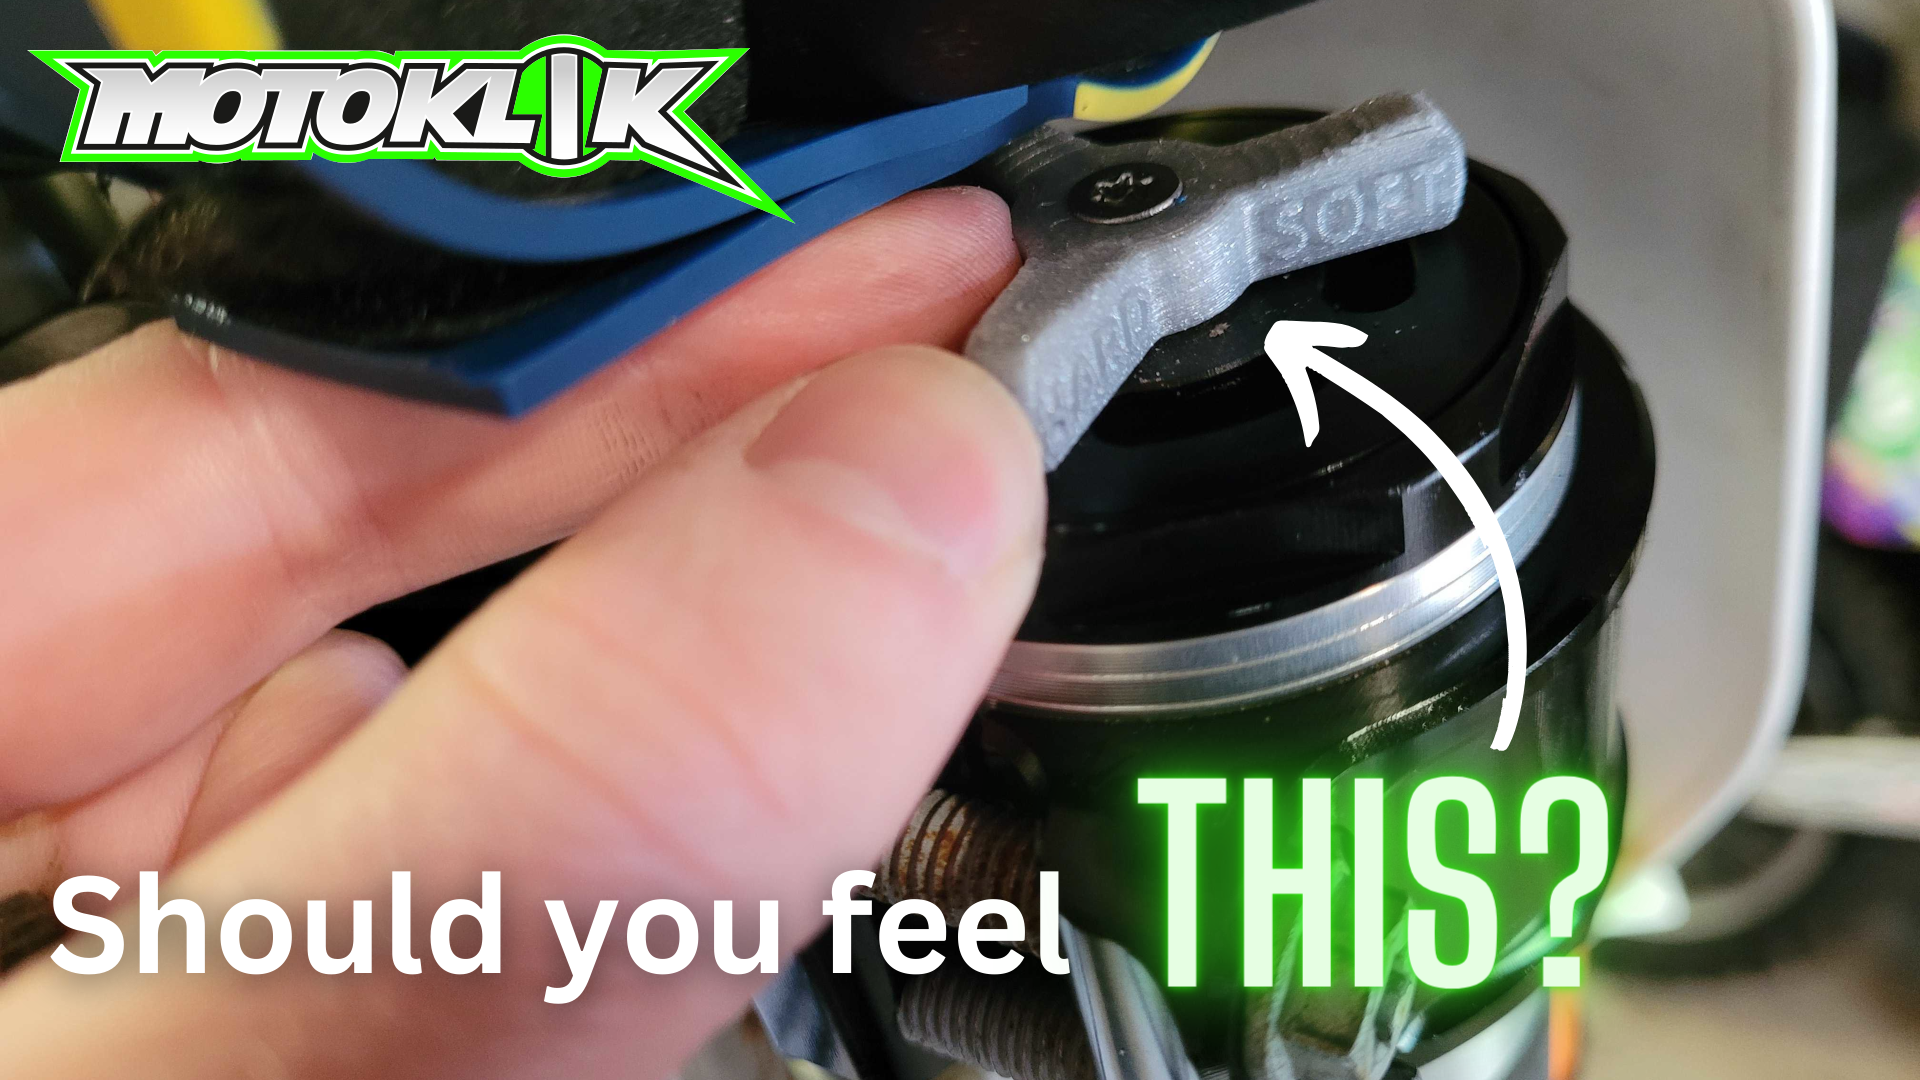
I often see it being said that riders should be able to “feel” everything that happens on track and relay that back to their suspension technician or team, but here’s the issue; the faster the suspension moves, the more difficult it is to feel the clicker changes.
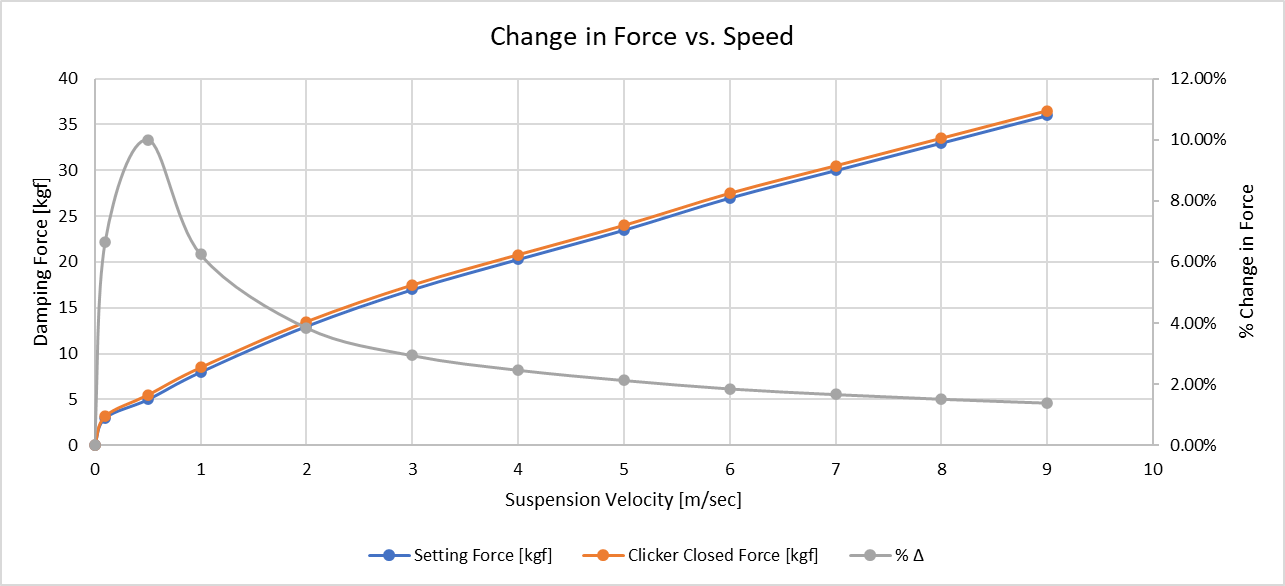
The graph below uses the data from above, and shows the percent change in force as the suspension moves faster. This is represented by the gray line. At low speeds (less than 1m/s), the change is quite substantial at nearly 10% for speeds of 0.5m/s. Thereafter though, the percent change drops off quite quickly, and by the time it get’s to 3m/s, there is only a 3% change in force. What does this mean in terms of feeling?
I want you to imagine we fill a bucket with water, and it’s left out on a bench in front of you. In the bucket, there is a flat plate with a handle attached sticking straight up from the bucket. There is space left all around the plate, so that the water can flow past the edge of the plate and the walls of the bucket. Move the plate up and down with the handle, and you will get a feel for the force of the water acting against it. Now, replace the water with maple syrup. It’s a lot tougher to move right?
The viscosity of water is 0.01 poise, and the viscosity of maple syrup is around 0.05 poise, so it takes 400% more force to move the plate in the bucket with maple syrup. That’s why we can easily feel the difference. If the water were 3% more viscous, it would be 0.0103 poise. How could we possibly feel that?
OK, so what, I can see a 10% difference there in the graph as well and surely that’s what the rider is feeling?
Let’s take a look at some real world data.
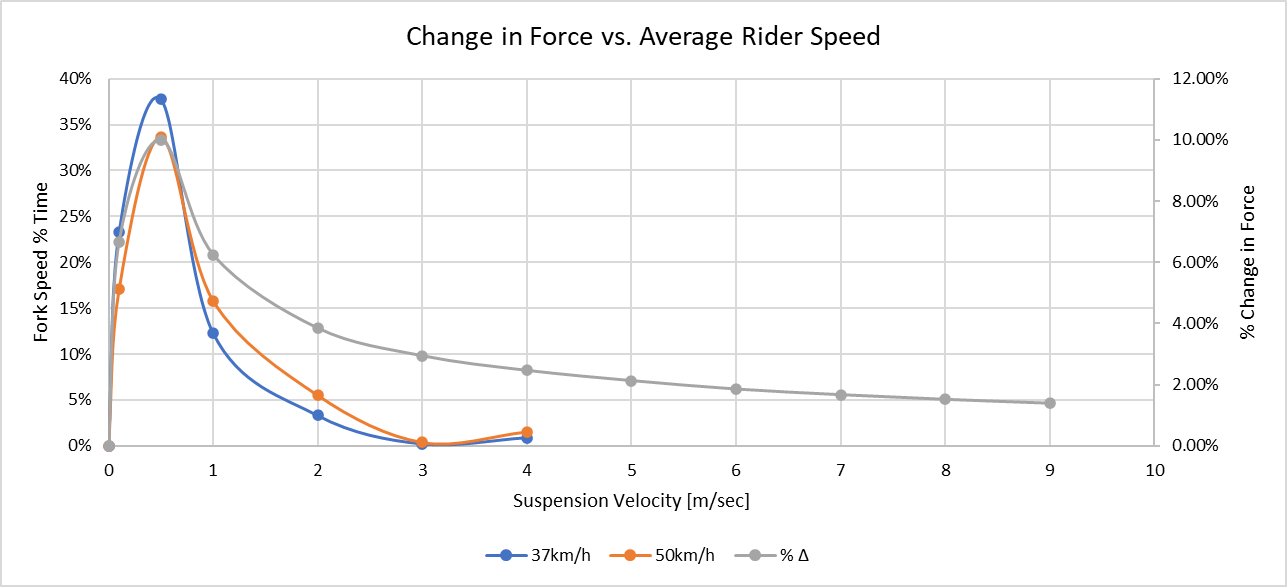
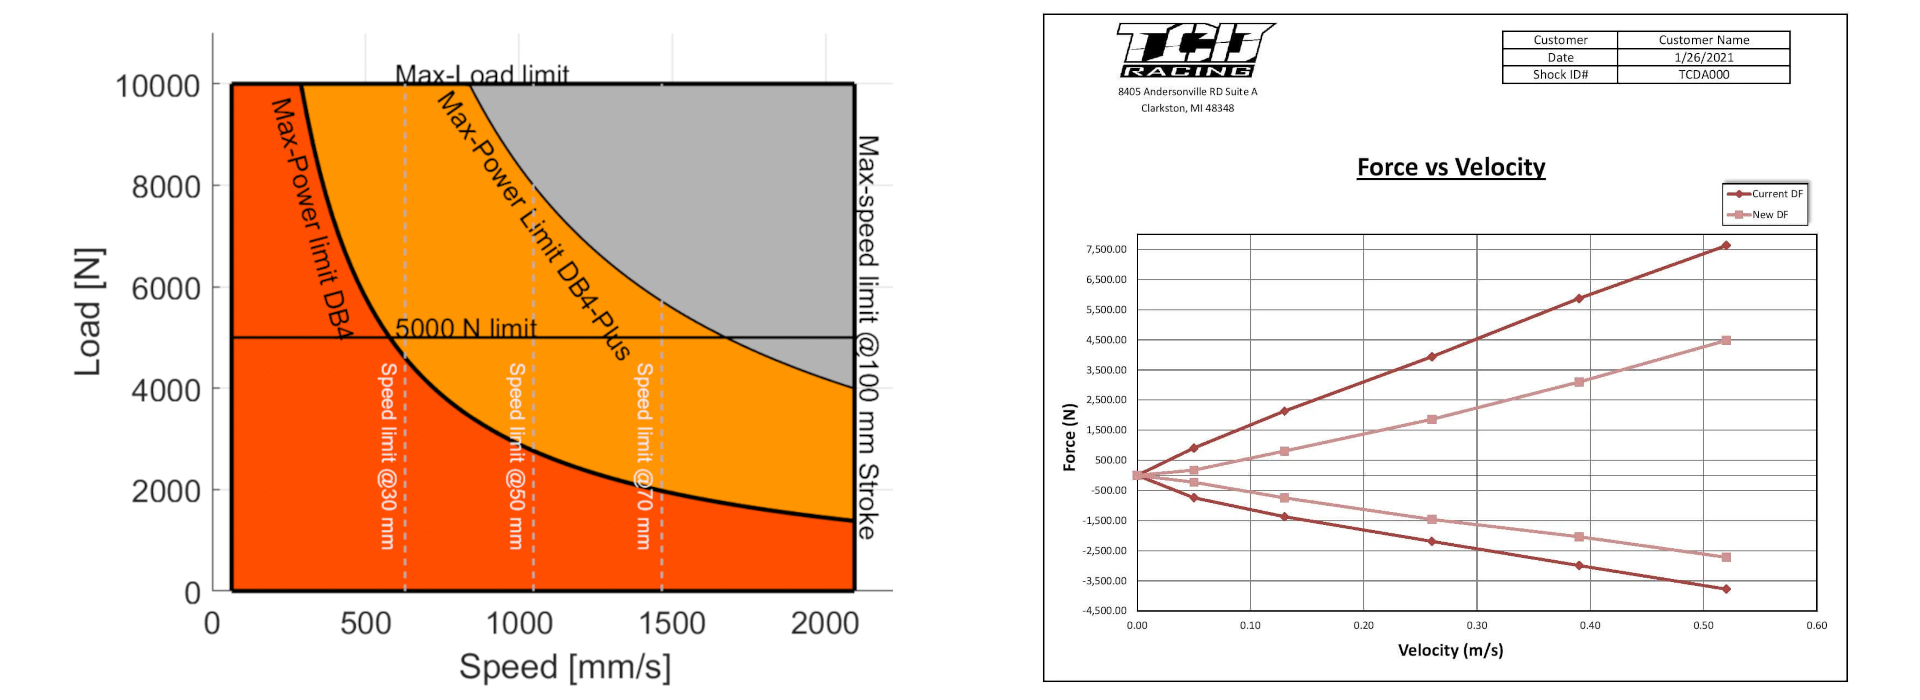
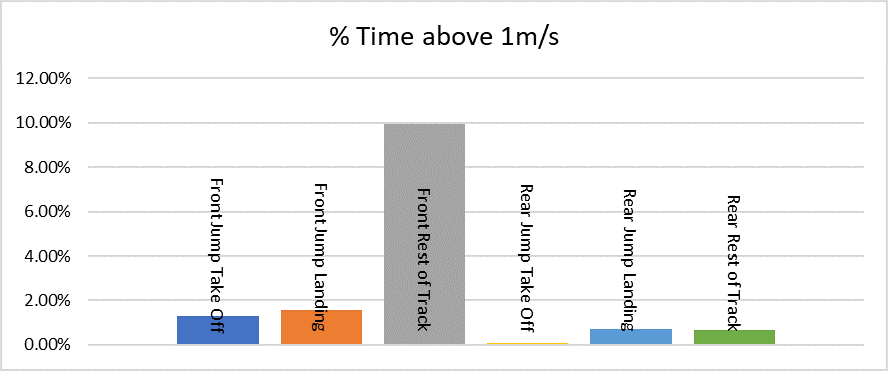
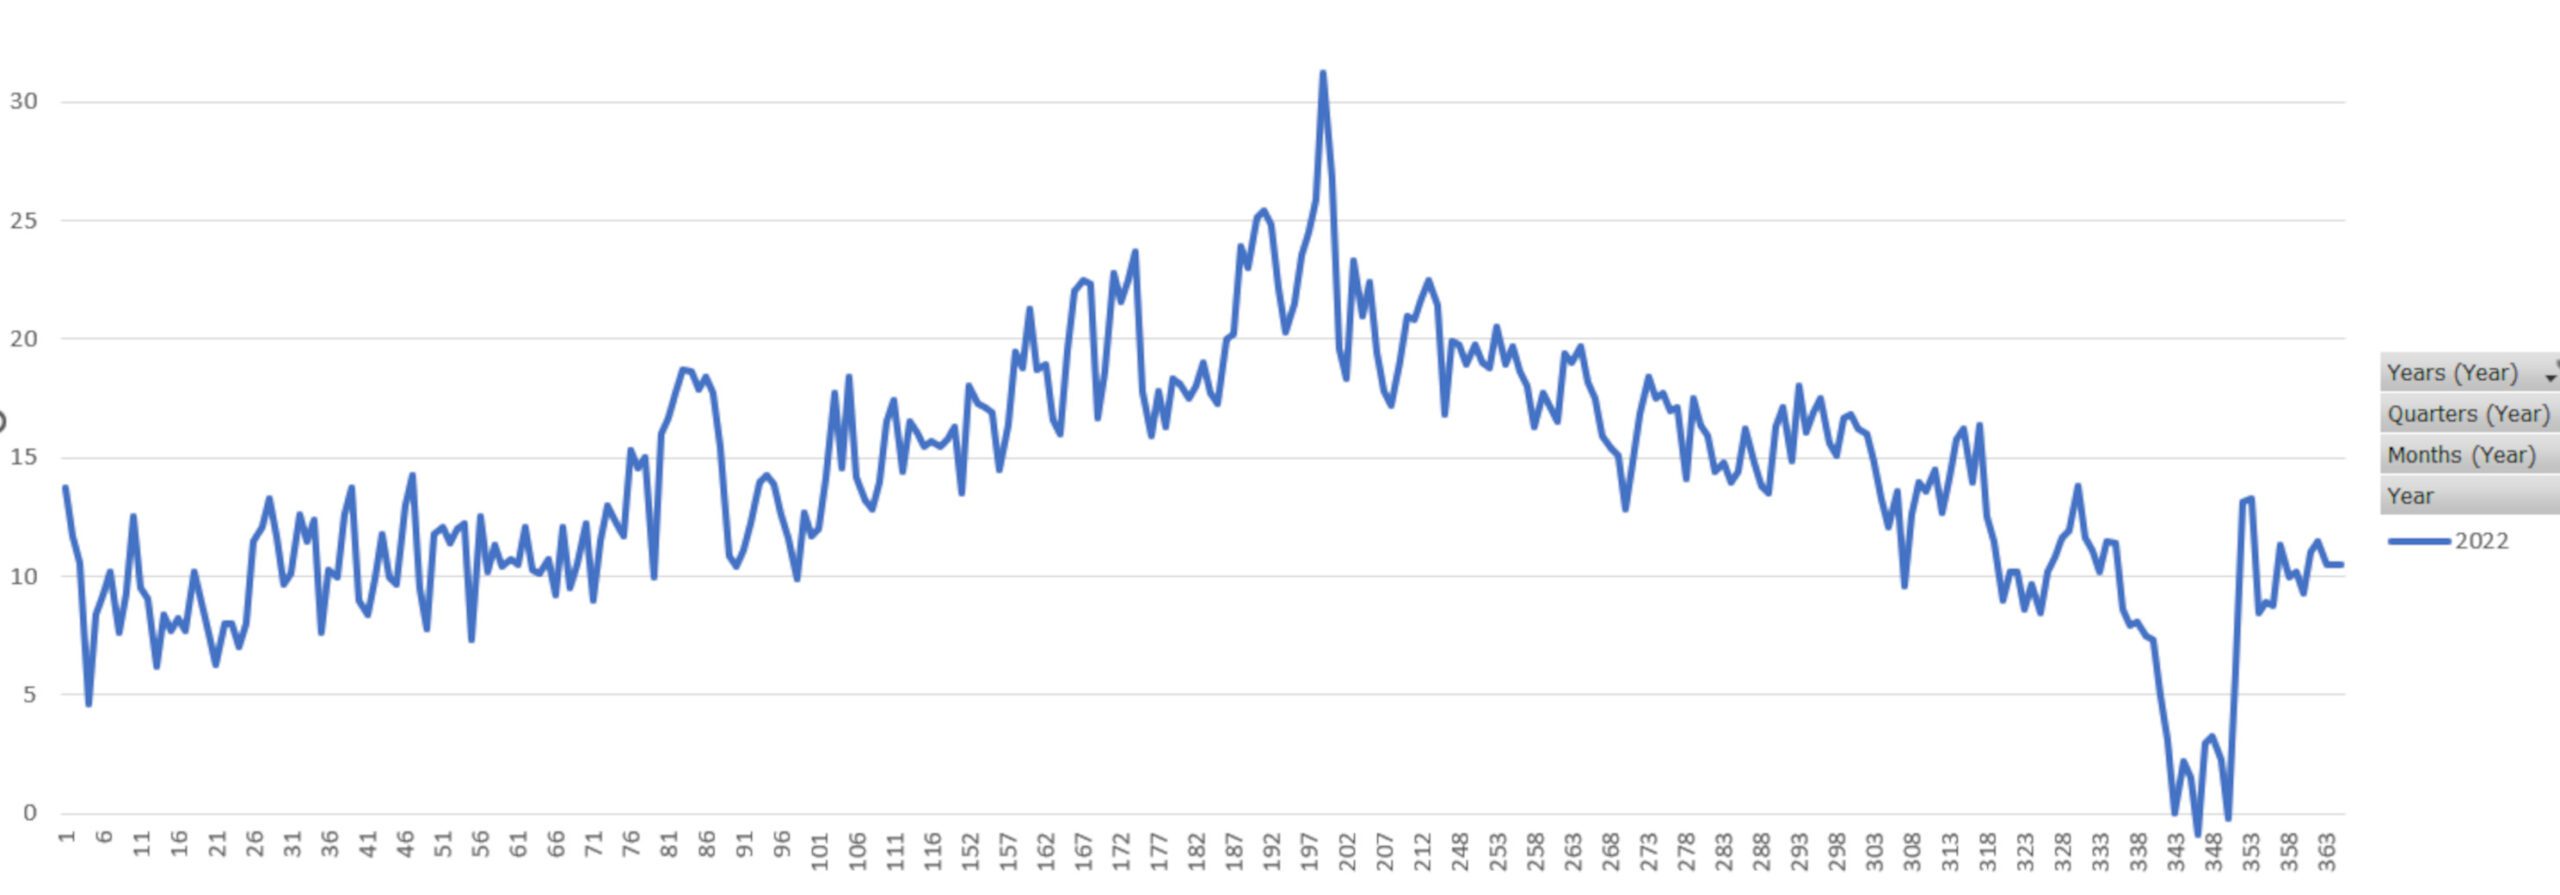
The graph above shows the percent time the forks spent at different compression speeds for two different riders. One rider had an average speed of 37km/h (blue line), and the other rider had an average speed of 50km/h (orange line). (No, they weren’t on a Yamaha and a KTM, that’s just a happy occurrence from Microsoft Excel’s colour choice ![]() )
)
Ah ha! The peaks of the graphs line up!
What this means is that most of the time the suspension is moving at around 0.5m/s, which matches up quite nicely with the peak change in force from the clickers. This is probably no coincidence, as the decades spent developing suspension from orifice style damping to closed cartridge would have been driven mostly by rider feel, and thus, the biggest effect from clickers happens at the speed the suspension spends most of its time at. You might have also noticed that the faster riders suspension spends less time at the lower speeds, and more time at the higher speeds, meaning that faster riders will need to be more sensitive to feel the clicker changes.
That’s a delightful way to end our story then right? We can just cure all riders problems with clickers?
Eh…. no.
There are two things that we need to account for.
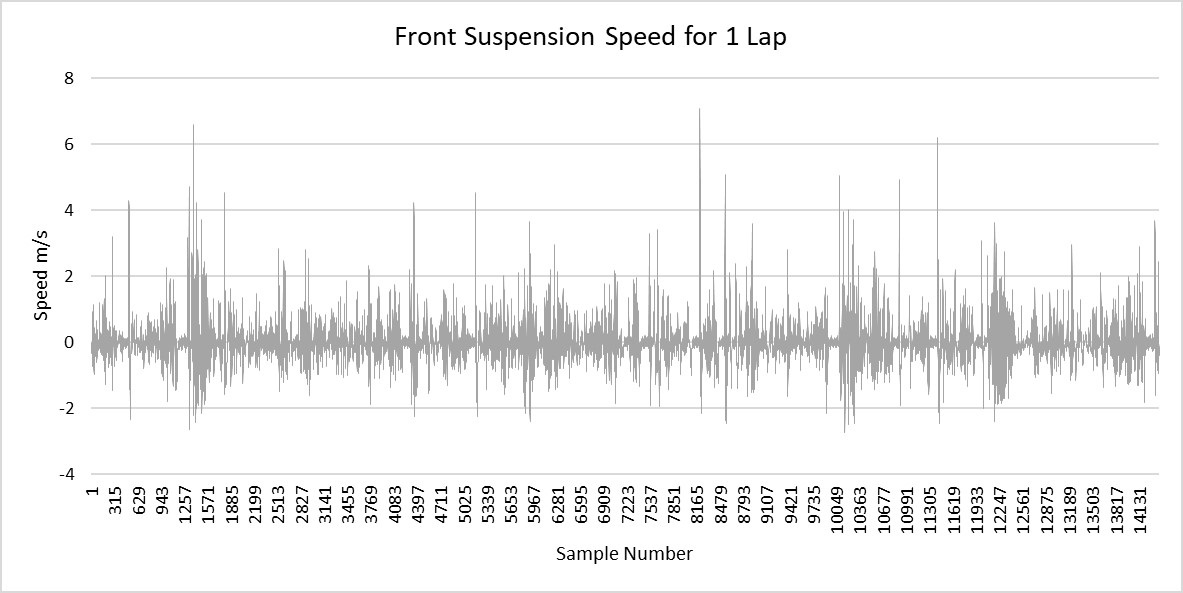
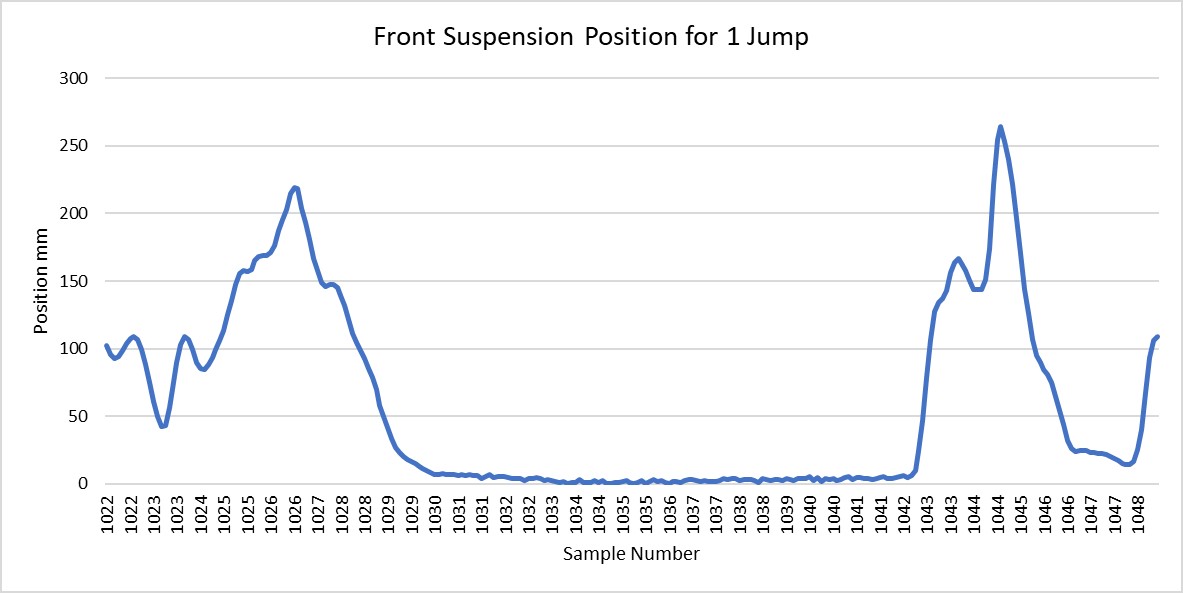
1. The suspension can still move at really high speeds up to 9m/s where the rider will find it incredibly difficult to feel the clicker changes. (We usually see this when landing from a jump, or hitting a really square edge hole) .
2. The damping force may just be way off, and you’ll never get to where you need to be with the clickers alone.
We’re on to the final stretch, bear with me!
Let’s take one last look at the first graph, and something we haven’t spoken about yet, the brown line. You might have noticed it is labeled as “baseline”, and the blue line is labelled as “setting”. What this means is that the technician has made a change to the shim stack layout of the valve in order to reduce the force from the original setting. E.g with the baseline at 5m/s, there was a force of 26.5kgf, but with the new setting the force is reduced to 23.7kgf, meaning the fork would feel softer.
With this configuration of clicker, you were never, ever, ever going to get that much of a change, so if the rider had an issue with a harsh feeling on square edge bumps, or bottoming of the fork, it was going to need a valve adjustment.
I have to caveat all of these articles with the fact that in the real world, things rarely behave in an ideal manner, and you will see differences in behaviour from clickers and valving configurations. Like maybe the clickers stop having an effect at higher speeds, or they have more of an effect at lower speeds, and all this can be seen through dyno testing.
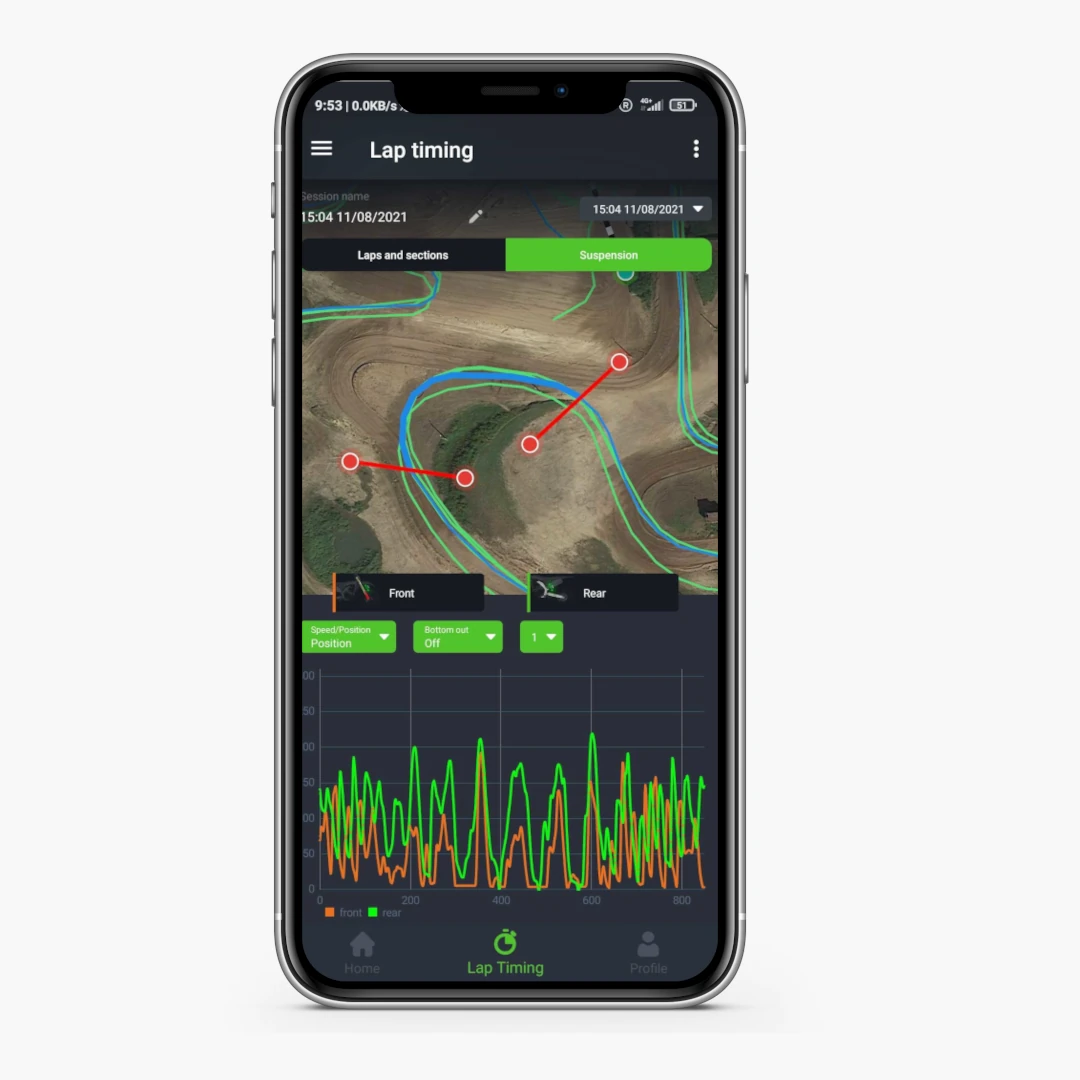
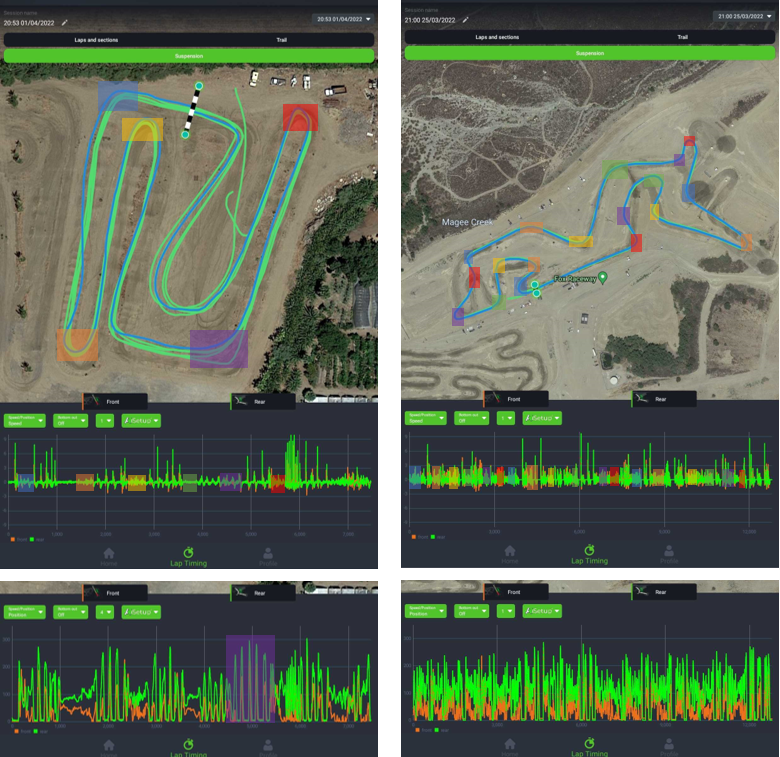
Hopefully though, you will see how using the Motoklik system, and the AiSetup can benefit your riding. There is a lot to be had from the clickers (up to 10% performance improvement based on this example!), and the beauty of it is, that Motoklik will identify if your suspension can be improved even further by either running you out of clicks, or by showing that the overall characteristic is too soft or too hard, in which case you will need to call on your local friendly suspension technician.
I hope you enjoyed this read, and you will find all our articles on the News section of our website!
If you’d like to work with us and the Motoklik system, feel free to email [email protected]
Kind Regards,
Jens