
In our last article, I wrote about the challenges of suspension data acquisition in motocross, and why we believe it hasn’t been widely used to date. As part of that discussion, I brought in some fairly abstract ideas to do with height of children versus adults, and how to accurately predict the temperature on a given day in Ireland. If you were brave enough to stick with that to the end, thank you, because today you will see where I was going with it!
Where we ended up was that by using a larger historic dataset based on averages, we can improve the standard deviation (σ; pronounced sigma) of our data, the ± bit. When σ is improved, we can make more accurate predictions about the value we should expect for height, temperature, or what we’re interested in, suspension speed. Let’s finally get to the good bit, looking at some actual suspension data measured by Motoklik.
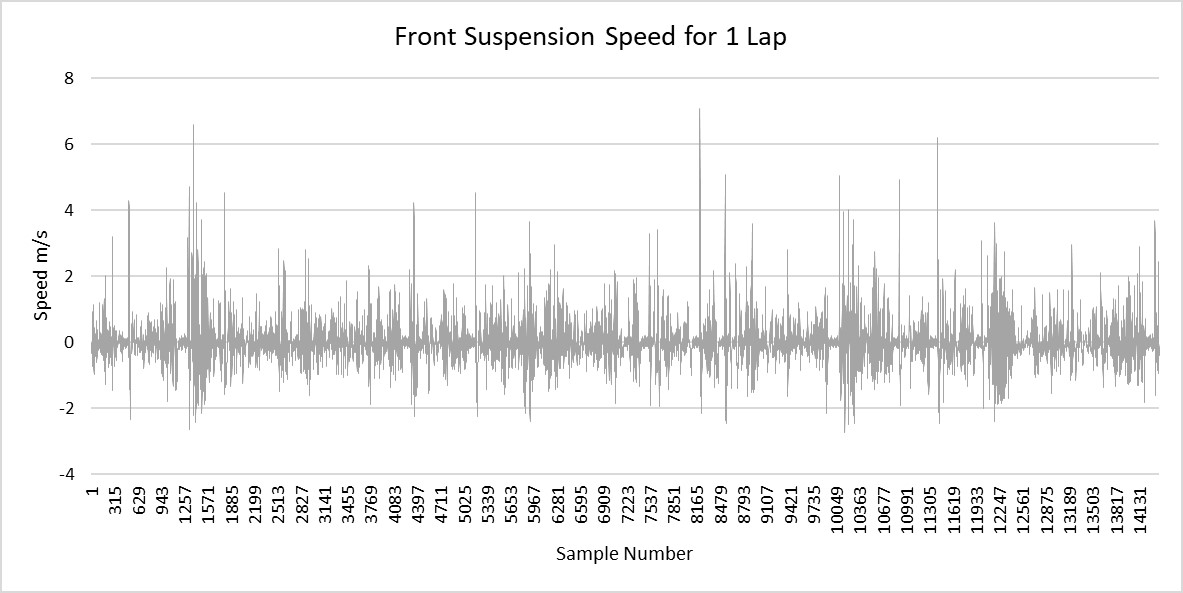
The image above shows the speed of the front forks over the course of one lap on a motocross track in Germany. Anything greater than 0m/s is compression, and less is rebound. Looking at the data like this, it all looks like a bit of a mess. If we are to take the average σ for the full lap, we get:
Front Compression = ±0.611 m/s
Front Rebound = ±0.382 m/s
Rear Compression = ±0.526 m/s
Rear Rebound = ±0.239 m/s
However, when we take a closer look, we can start to see some patterns…
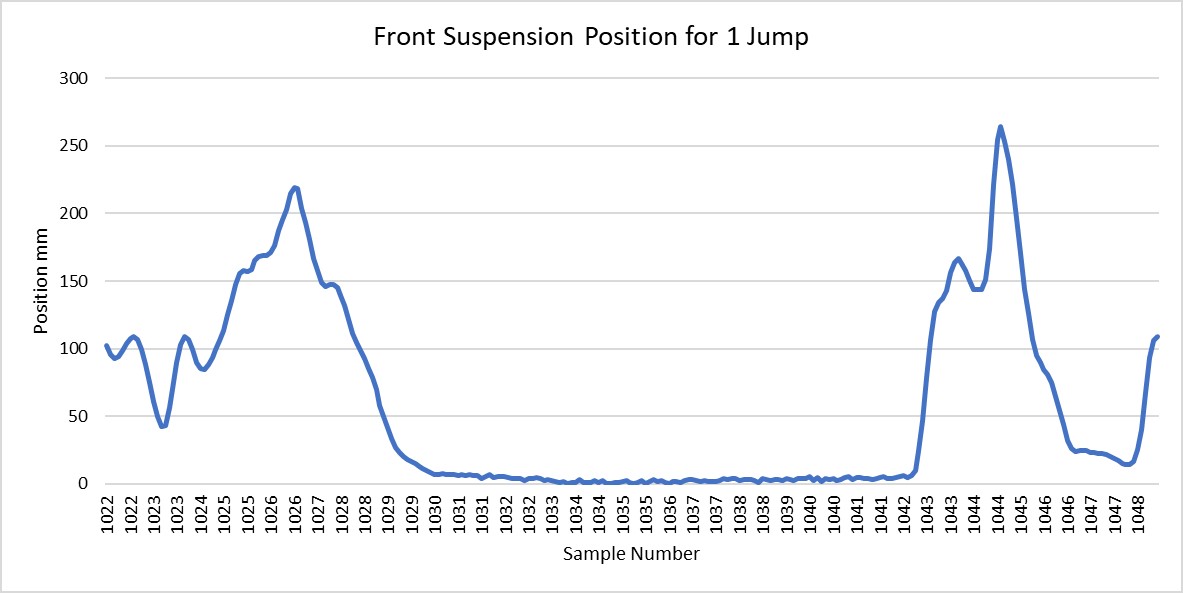
Any guess for what the data above is?
Yes, you’re right it’s a jump! (Well maybe you read it from the graph title, but I’ll give you the benefit of the doubt 😉). It’s pretty easy to recognise how the forks are compressed on the upramp, how they stay fully extended in the air, and how they compress again on the landing.
Let’s look at another example.
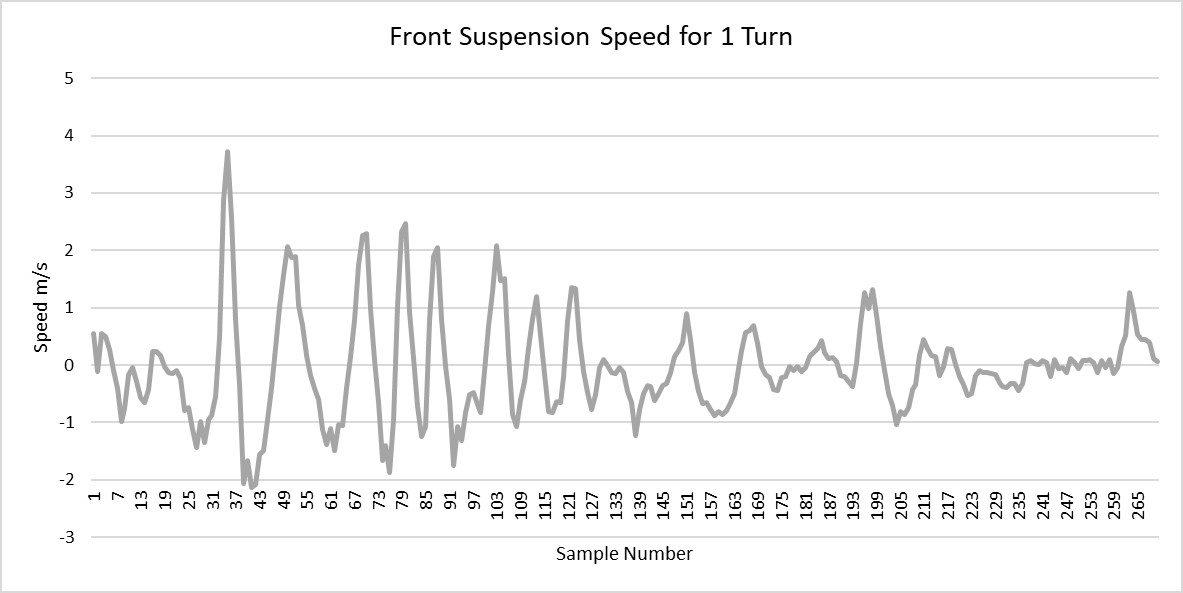
No guessing this time, this is data from a turn on the track. It shows the speed of the front suspension. You can see on corner entry how the forks are compressing and rebounding at much higher speeds than they are exiting the corner. The apex of this turn is around sample number 151.
The point I am making is that as we start to look at the data more closely, we can see how some data is more related than others, so if we are to group all of the data from turns together, and all of the data from jumps together, and from braking and accelerating and so on, what do you think might happen to our σ?
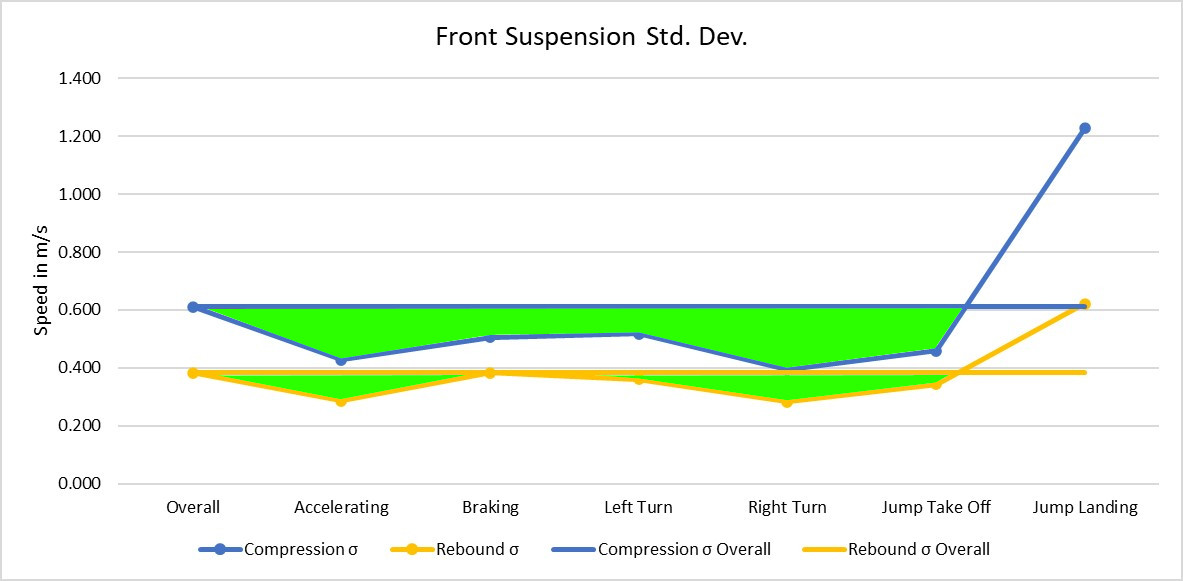
The image above shows the front fork σ for the overall lap, as well as for the different sections of track we have grouped together. The blue line represents compression, and the yellow rebound. The green space between the flat line, and the data line shows how much we have improved the σ by grouping the data together. We see a really good improvement for most things, except for maybe braking, and jump landings. Remember, a smaller σ allows us to make more accurate predictions!
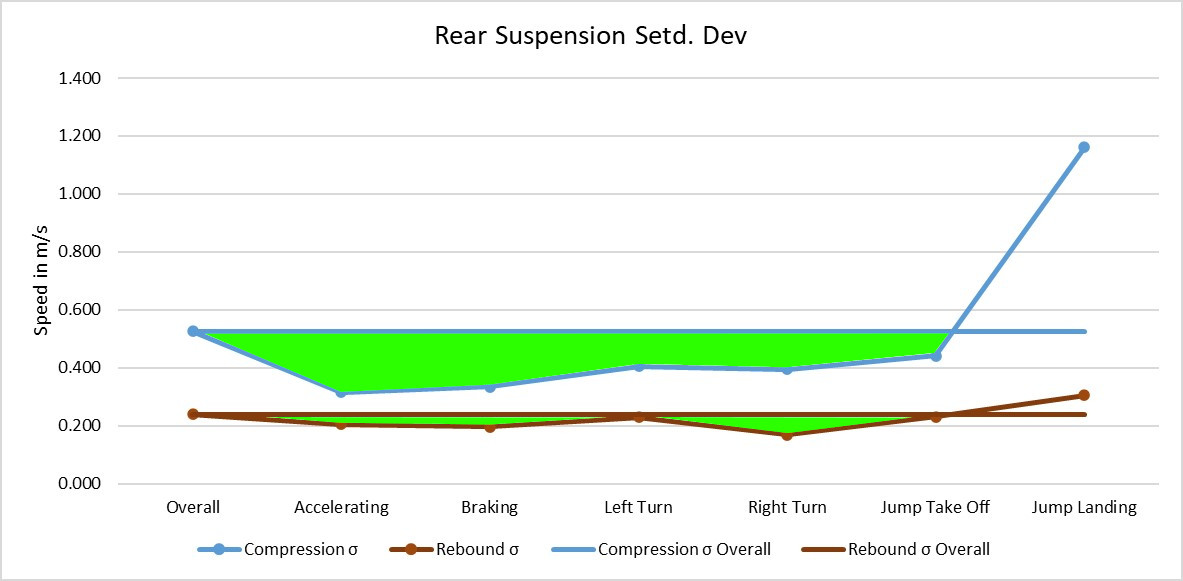
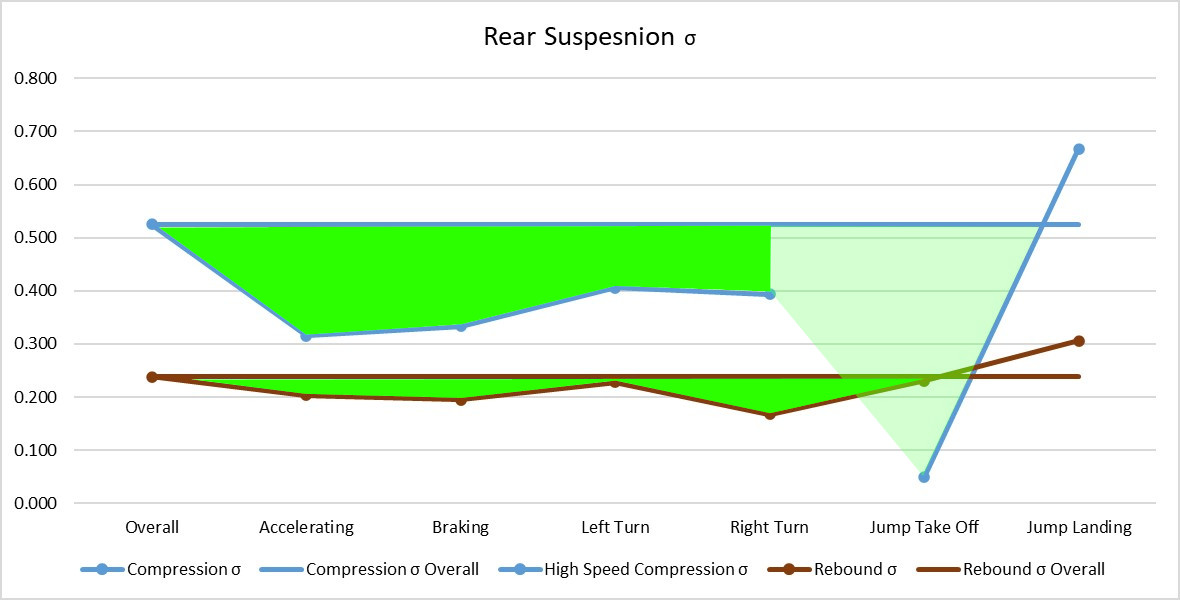
The image above shows the rear axle σ for the overall lap, as well as for the different sections of track we have grouped together. The blue line represents compression, and the red rebound.
So overall we are showing a massive improvement in the accuracy of compression data, and some good improvements for rebound, but the rebound data was already more accurate than compression from the get go.
There is one Achilles heal though, and that’s the jump landing data. On both front forks and the rear, we got a significantly worse σ value 🥹 Does this mean all our hard work was for nothing? Surely we can find an answer that makes this all worth while.
Stop and have a think about what we could do next…
Well what do we know about jumps? From the “Front Suspension Position for 1 Jump” graph closer to the start of this article, we can see that when we are taking off and landing from a jump, that the suspension moves a big distance in a short amount of time. This must mean that the suspension on average is moving a lot faster on a jump than elsewhere on the track. Is this true?
We can check this easily by calculating the average speed of the suspension movement for each of our grouped sections. It gives the following results:
Front Compression Lap Average: 0.476 m/s
Front Compression Jump Landing Average: 0.907 m/s
Rear Compression Lap Average: 0.463 m/s
Rear Compression Jump Landing Average: 1.108 m/s
Hey! 😲That’s a pretty big difference in average speed!
Now we know that adjustments to higher speed movements of the suspension will have the biggest effect on jumps. Let’s try adding a group, within a group, and see what it does to our σ value for jumps.
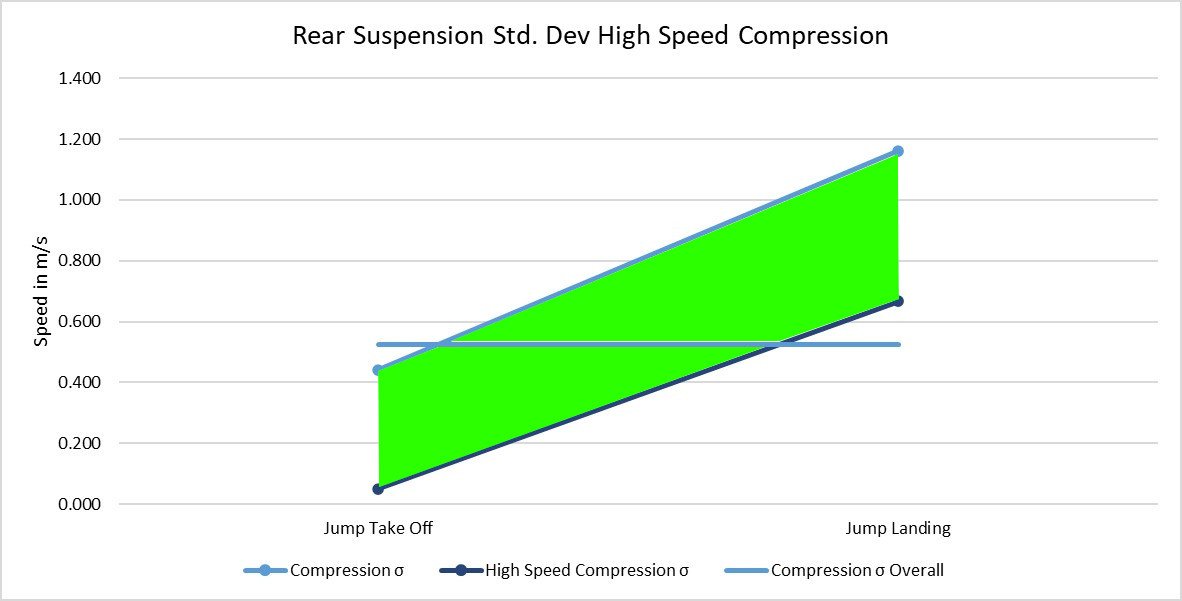
When we filter out the low speed movement of the compression from the data, we dramatically improve the accuracy of predictions for jump take off’s and landings. We have to be a little bit careful here though for two reasons:
1: When we look at the jump take off speeds, there aren’t that many that reach up into the higher threshold, which in most cases is going to give us a better σ value by default.
2: The jump landing σ still isn’t quite as good as the overall σ, but it is a whole lot better than where it was.
Right, let’s try and wrap this thing up.
It can be easy to dive into all these numbers and get very excited, but it’s more important to not lose sight of what we are actually trying to achieve.
We are trying to give riders the best suspension setup possible for the current track conditions and their riding style.
On most suspension we can control the low speed compression and rebound on the front and rear, and the high speed compression on the rear via the clickers. We know now that jump data is mainly comprised of high speed movement of the suspension.
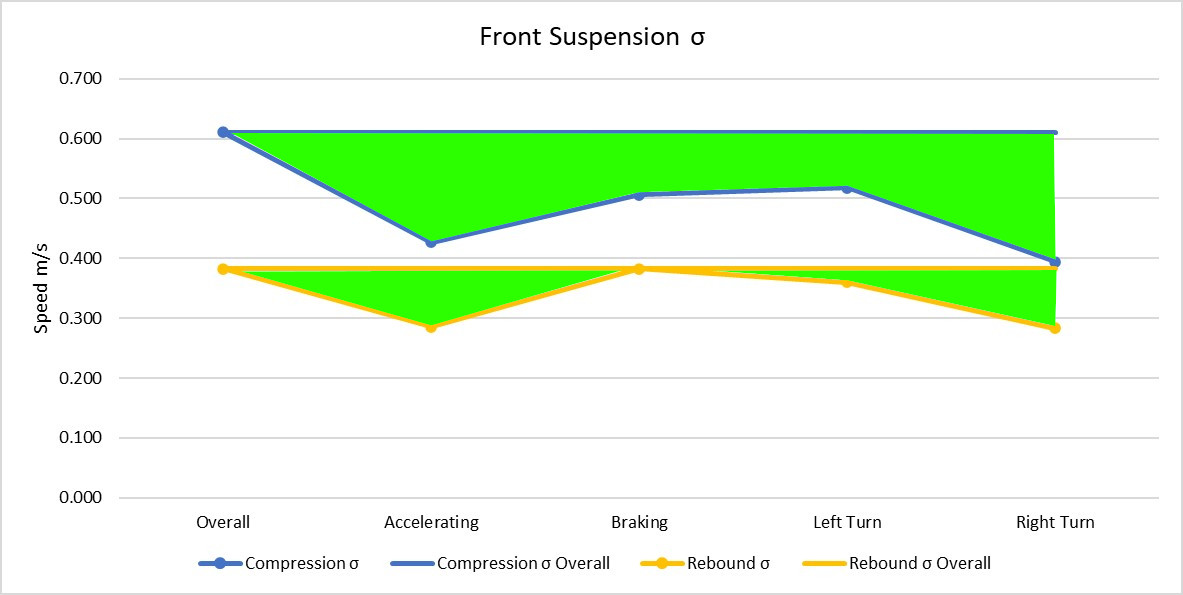
If we redesign our graphs to those shown above, we can look at how much we have improved the accuracy of our predictions for the clicker adjustments by grouping the data together in related track sections. We can even take this a few steps further, and add in more sub-groups to group the data together even more.
As you can imagine, to break out the track like this manually for every lap and every section can be a terribly time consuming task, but the results are totally worth it for the improvement we get in suspension setup prediction accuracy.
I think that’s enough for today’s discussion, and if you’ve made it all the way to the end, thank you for your time.
If you would like to work with us, or use the Motoklik system yourself, and you have a few questions, feel free to send an email to [email protected] 🙂
Kind Regards,
Jens